1. User Manual: SCN-500
Part No.: 4031.605.50001
Revision: 27
Date: June 2022
2. Limited Warranty
2.1. Hardware
2.1.1. Certification
Detectus AB certifies that this product meets its published specifications at the time of shipment from the factory. Detectus AB further certifies that its calibration measurements are traceable to Detectus AB Standards.
2.1.2. Warranty
This Detectus AB system is warranted against defects in material and workmanship for a period of one year from date of shipment. During the warranty period, Detectus AB will, at its option, either repair or replace products that prove to be defective.
For warranty service or repair, this product must be returned to a service facility designated by Detectus AB. The Buyer shall pay shipping charges for transport to Detectus AB and Detectus AB shall pay shipping charges to return the product to Buyer. However, The Buyer shall pay all shipping charges, duties, and taxes for products returned to Detectus AB from countries outside of Sweden.
2.1.3. Limitation of Warranty
The foregoing warranty shall not apply to defects resulting from improper or inadequate maintenance by the Buyer, Buyer-supplied software or interfacing, unauthorized modification or misuse, operation outside of the environmental specifications for the product, or improper site preparation or maintenance.
NO OTHER WARRANTY IS EXPRESSED OR IMPLIED. DETECTUS AB SPECIFICALLY DISCLAIMS THE IMPLIED WARRANTIES OF MERCHANTABILITY AND FITNESS FOR A PARTICULAR PURPOSE.
2.1.4. Exclusive Remedies
THE REMEDIES PROVIDED HEREIN ARE BUYER’S SOLE AND EXCLUSIVE REMEDIES. DETECTUS AB SHALL NOT BE LIABLE FOR ANY DIRECT, INDIRECT, SPECIAL, INCIDENTAL, OR CONSEQUENTIAL DAMAGES, WHETHER BASED ON CONTRACT, TORT, OR ANY OTHER LEGAL THEORY.
2.1.5. Assistance
Product maintenance agreements and other customer assistance agreements are available for Detectus AB products. For any assistance, contact your nearest Detectus AB sales and Service Office.
2.2. Software
2.2.1. Limited Warranty on Media and Manuals
If you discover physical defects in the media on which this software is distributed or in the manuals distributed with the software, Detectus AB will replace the media or the manuals at no cost, provided that you return the defective materials along with a copy of your receipt to Detectus AB or to an authorized dealer during the 1-year period following your receipt of the software.
2.2.2. Limited Warranty on the Product
Detectus AB warrants that the software will perform substantially as described in this document. If within one (1) year of receiving the software you give written notification to Detectus AB of a significant, reproducible error in the software which prevents its operation, and provide a written description of the problem, Detectus AB will either provide you with corrective or work-around instructions, a corrected copy of the software, or refund your purchase price upon return of all copies of the software and documentation together with a copy of your receipt.
EXCEPT FOR THE LIMITED WARRANTY DESCRIBED ABOVE, THERE ARE NO WARRANTIES TO YOU OR ANY OTHER PERSON OR ENTITY FOR THE PRODUCT EXPRESSED OR IMPLIED, INCLUDING BUT NOT LIMITED TO THE IMPLIED WARRANTIES OF MERCHANTABILITY AND FITNESS FOR A PARTICULAR PURPOSE, ALL SUCH WARRANTIES ARE EXPRESSLY AND SPECIFICALLY DISCLAIMED.
Some states do not allow the exclusion of implied warranties or limitation on how long they last, so the above limitation and exclusion may not apply to you. This limited warranty gives you specific legal rights and you may also have other rights, which vary from country to country.
IN NO EVENT SHALL DETECTUS AB BE RESPONSIBLE FOR ANY DIRECT, SPECIAL, INCIDENTAL, CONSEQUENTIAL, OR SIMILAR DAMAGES OR LOST DATA OR PROFITS TO YOU OR ANY OTHER PERSON OR ENTITY REGARDLESS OF THE LEGAL THEORY, EVEN IF WE HAVE BEEN ADVISED OF THE POSSIBILITY OF SUCH DAMAGE.
Some countries do not allow the exclusion or limitation of incidental or consequential damages, so the above limitation may not apply to you. The warranty and remedies set forth are exclusive and in lieu of all others, oral or written, express or implied.
3. Technical data
3.1. EMC Scanner (DS,Rx series)
| RS321 | RS642 | RS644 | |
| Movement in XYZ-axis: | 300x200x100 mm | 600x400x200 mm | 600x400x200 mm |
| Size: | 620x400x550 mm | 920x600x750 mm | 920x600x950 mm |
| Weight: | 20 kg | 27 kg | 35 kg |
| Accuracy: | +/- 0.3 mm |
| Min step size: | 1 mm |
| Line voltage: | 230V/110V, -15%, +10% |
| Line frequency: | 50Hz/60Hz, +/- 2Hz |
| Power consumption: | <25W |
| Power con. standby: | <20W |
| Environment temp.: | +10 C to +35 C |
| Humidity: | 20% to 80% |
| Communication: | RS-232 or Ethernet |
| Software: | Requires Windows 10. Configurable for most spectrum analyzers. Configurable for National GPIB-adapters. |
3.2. Heat Scanner Option (DS,Rx series)
| Scanner: | See product leaflet of EMC Scanner |
| Temperature range: | 0-150 °C |
| Resolution: | +/- 0.3 °C |
| Point of measuring: | 6 mm diameter at a distance of 200 mm. |
| Response time: | 500 ms |
3.3. EMC Scanner (HR series)
| HR-1 | HR-3 | |
| Movement in XYZ-axis: | 190x140x80 mm | 390x280x130 mm |
| Size: | Width:535 Depth:600 Height:690 mm | Width:780 Depth:850 Height:810 mm |
| Weight: | 95 kg | 125 kg |
| Accuracy: | +/- 0.05 mm |
| Min step size: | 0.025 mm |
| Line voltage: | 230V/110V, -15%, +10% |
| Line frequency: | 50Hz/60Hz, +/- 2Hz |
| Power consumption: | 1150W |
| Environment temp.: | +10 C to +35 C |
| Humidity: | 20% to 80% |
| Communication: | RS-232 or Ethernet (UTP) |
| Software: | Requires Windows 10. Configurable for most spectrum analyzers. Configurable for National GPIB-adapters. |
3.4. EMC Scanner (SCN-500 series)
| SCN-522 | SCN-524 | SCN-534 | SCN-564 | |
| Movement in XYZ-axis (mm): | 200×100 | 200x100x100 | 300x200x100 | 600x400x300 |
| Rotation around Z axis (Y/N): | N | Y | Y | Y |
| Size: | 450x370x430 mm (17.7×14.6×16.9”) | 450x370x630 mm (17.7×14.6×24.8”) | 550x470x630 mm (21.7×18.5×24.8”) | 850x670x830 mm (33.5×26.4×32.7”) |
| Weight: | 11 kg (24 lbs) | 13 kg (29 lbs) | 15 kg (33 lbs) | 23 kg (51 lbs) |
| Min step size: | 0.1 mm |
| Line voltage: | 100 – 240 Vac |
| Line frequency: | 50Hz/60Hz |
| Power consumption: | 45W |
| Operating temp.: | +10°C to +35°C |
| Storage temp.: | -40°C to +71°C |
| Humidity: | 20% to 80% (+10°C to +35°C) |
| Maximum height over sea level: | 2000 m. |
| Over voltage category: | OVC II |
| Laser Safety: | CLASS 2 LASER PRODUCT IEC 60825-1: 2014 P 1mW; λ=670nm COMPLIES WITH 21 CFR 1040.10 AND 1040.11 EXCEPT FOR CONFORMANCE WITH IEC 60825-1 ED. 3., AS DESCRIBED IN LASER NOTICE NO. 56, DATED MAY 8, 2019. |
| Safety: | EN 61010-1:2010/A1:2019/AC:2019-04: Safety requirements for electrical equipment for measurement, control, and laboratory use. |
| EMC: | EN/(IEC) 61000-6-3:2007: Electromagnetic compatibility (EMC) — Part 6-3: Generic standards — Emission standard for residential, commercial and light-industrial environment. EN/(IEC) 61000-6-1:2007: Electromagnetic compatibility (EMC) — Part 6-1: Generic standards — Immunity for residential, commercial and light-industrial environment |
| Communication: | USB 2.0 |
| Software: | Requires Windows 10. Configurable for most spectrum analyzers. Configurable for National GPIB-adapters. |
4. Safety Instructions
4.1. Introduction
Read this page carefully before you install and use the instrument. This instrument has been designed and tested according to safety Class 1 requirements of EN61010-1:2010 and, and has been supplied in a safe condition.
The user of this instrument must have the required knowledge of it. This knowledge can be gained by thoroughly studying this manual.
This instrument is designed to be used by trained personnel only. Removal of the cover for repair or rack-mounting of the instrument must be done by qualified personnel who are aware of the hazards involved.
4.2. Safety Precautions
To ensure the correct and safe operation of this instrument, it is essential that you follow generally accepted safety procedures in addition to the safety precautions specified in this manual.
4.3. Caution and Warning Statements
CAUTION: Shows where incorrect procedures can cause damage to, or destruction of equipment or other property.
WARNING: Shows a potential danger that requires correct procedures or practices to prevent personal injury.
4.4. Safety Precautions
The machine may only be used in accordance with the provisions of this manual. For the damage caused by use of the machine for other applications then the machine has been developed, closes the manufacturer Detectus AB/ Pendulum Instruments Sp. z o.o from any liability.
CAUTION:
- Before commissioning the machine, make sure that the mains voltage (that is specified on the name plate of the individual components) is in accordance with the existing mains voltage in your plant or working place. A wrong voltage can destroy the machine and its components. The machine may be connected to any AC supply with a voltage rating of 100 to 240 Vrms, 50 to 60 Hz. The machine automatically adjusts itself to the input line voltage.
- Under no circumstances should you operate a machine at the locations where there could be a risk of water and other liquids penetrating.
- The dimensions of the machine must be taken into the consideration to prevent moving axis from crushing into objects around it.
- Make sure that support table that machine is placed on, is capable of withstanding the weight and dynamic forces of the scanner and the test object. Inadequate support table can break and cause the machine to fall off.
- Clean plastic and painted surfaces of the machine with a suitable cleaning agent only (household, non-abrasive cleaning agents). Using inappropriate agents may destroy surfaces of the machine. The metal rails and screw is supposed to be greased and must not be wiped dry.
- Temperature of the test objects should be less than 100 degrees Celsius. Higher temperatures may cause surfaces of the machine to melt and potentially cause a fire hazard.
- The machine must not be placed in potentially explosive atmospheres.
WARNING:
- To avoid electrical shock do not insert objects into the machine imports; except for the intended replacement of parts in accordance to this User Manual.
- For the implementation of maintenance work always disconnect the machine from the AC power grid.
- Opening the machine for repair or any other purpose may lead to exposure to live wires and as a result cause electric shock. Only authorized service technicians are allowed to perform the aforementioned actions.
- When laying out the mains cable be careful that you avoid tripping hazards and prevent damage to the electric main.
- Ensure cables of the scanner/test object are free from damage and do not have any non-standard joints or show any signs of overheating. Cracked wire insulation caused by heat, age, corrosion or bending may lead to electric shock.
- Be sure not to put your fingers, hair or clothing close to the moving sections in order prevent pinching or accident that can result in personal injury. Operators are required to wear the proper clothing at all times, hair should be covered to avoid entanglement. Jewellery such as rings and necklaces must also be removed.
4.5. Grounding
Whenever an instrument is connected to the line voltage, a grounding fault will make it potentially dangerous. Before connecting any unit to the power line, you must make sure that the protective ground functions correctly. Only then can a unit be connected to the power line and only by using a three-wire line cord. No other method of grounding is permitted. Extension cords must always have a protective ground conductor.
WARNING:
- If a unit is moved from a cold to a warm environment, condensation may cause a shock hazard. Ensure, therefore, that the grounding requirements are strictly met.
- Never interrupt the grounding cord. Any interruption of the protective ground connection inside or outside the instrument or disconnection of the protective ground terminal is likely to make the instrument dangerous.
4.5.1. Option SLDM (laser distancing meter) safety information
The Option SLDM sensors operate with a semiconductor laser with a wavelength of 670 nm (visible/red).
The sensors fall within Laser Class 2 (II). The laser is operated on a pulsed mode, the maximum optical power is ≤ 1 mW.
The pulse frequency depends on the adjusted measuring rate (0.25 … 4 kHz).
The pulse duration of the peaks is regulated depending on the measuring rate and reflectivity of the target and can be 0.3 … 3999.6 µs.
Observe the laser protection regulations. Although the laser output is low, directly looking into the laser beam must be avoided. Close your eyes or immediately turn away if the laser beam hits the eye.
The housing of the optical sensors may only be opened by the manufacturer.
For repair and service purposes, the sensors must always be sent to the manufacturer.
Lasers of Class 2 (II) are not subject to notification and a laser protection officer is not required. During operation of the sensor, the pertinent regulations according to IEC 60825-1 on „Safety of laser products“ must be fully observed at all times. The sensor complies with all applicable laws for the manufacturer of laser devices.
CAUTION:
- Avoid unnecessary laser radiation to be exposed to the human body.
WARNING:
- Switch off the sensor for cleaning and maintenance.
- Use of controls or adjustments or performance of procedures other than those specified may cause harm.
- Connect the power supply and the display-/output device according to the safety regulations for electrical equipment. (Damage to or destruction of the sensor)
- Avoid shocks and impacts to the sensor. (Damage to or destruction of the sensor)
- The laser option can be used only with original power supply (Damage to or destruction of the sensor)
- Protect the sensor cable against damage. (Failure of the measuring device)
- Avoid constant exposure of sensor to splashes of water. (Damage to or destruction of the sensor)
- Avoid exposure of sensor to aggressive media like detergents, cooling emulsions. (Damage to or destruction of the sensor)
4.6. Symbols
 Shows where the protective ground terminal is connected inside the instrument. Never remove or loosen this screw
 Indicates that the operator should consult the manual.
4.7. If in Doubt about Safety
Whenever you suspect that it is unsafe to use the instrument, you must make it inoperative by doing as follow
- Disconnect the line cord
- Clearly mark the instrument to prevent its further operation
- Inform your local Detectus/Pendulum Service Center.
For example, the instrument is likely to be unsafe if it is visibly damaged.
4.8. Introduction
The EMC Scanner measures the emission from components, cables, PCB’s and products. The system consists of an X-Y-Z robot, a spectrum analyzer with near field probes, possibly a GPIB adapter for communicating with the spectrum analyzer and a personal computer with custom software.
During measurement the robot moves the near field probe to predetermined measuring points above the test object. At each measuring point the location of the probe and the value of the emission intensity are stored in the computer. When the measurement is finished, the results can be documented in different types of reports.
5. Hardware (HR series)
5.1. Front panel

1. Power on button
Click here to power up the Scanner.
2. Safety key
Auto: The Scanner can only be operated when the cover is closed.
Test: The Scanner can be operated even if the cover is open.
Operating the Scanner with the cover open may be dangerous.
The moving parts inside the Scanner may hurt you.
DO NOT OPERATE THE SCANNER WHEN THE COVER IS OPEN!
3. Power off button
Click this button to shut down the Scanner.
4. Cover lock release
To open the cover you must pull the cover handle down and then press the cover release button.
5. Not in use
6. Hardware (SCN-500 series)
6.1. Front panel
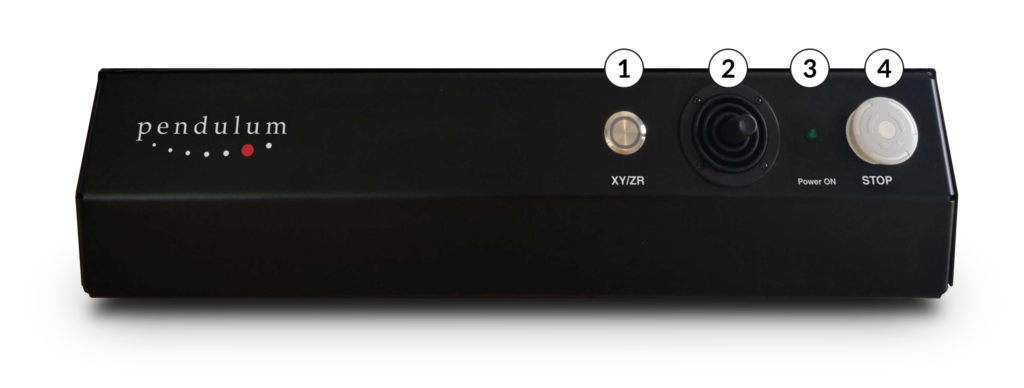
1. ZY/ZR selection
When unpressed, the joystick (2) operates the X and Y axes. When pressed, the joystick (2) operates the Z and R axes. The LED in the button indicates that ZR axes are activated for moving with the joystick. When not lit, XY axes are activated.
2. Joystick for moving the probe
3. Power on indicator
Green light indicates power on. No light indicate no power.
4. Machine stop button
Press to quickly turn off the power to all motors.
Turn clockwise to release the button and turn power on.
6.2. Back panel
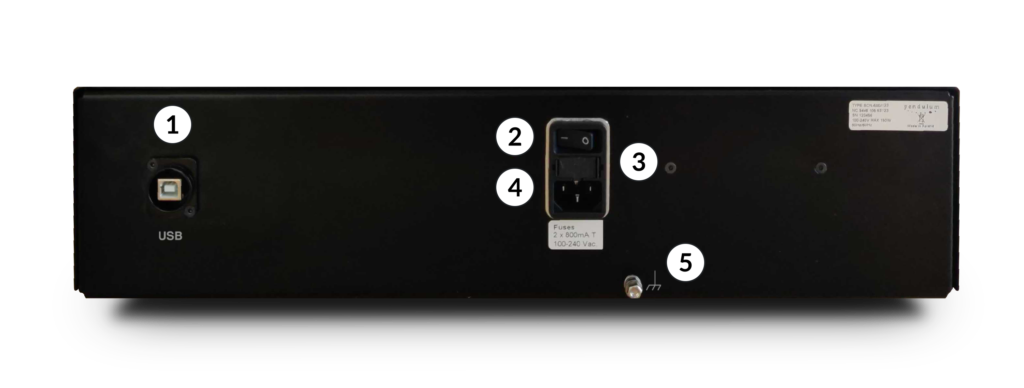
1. USB connector
For communication with PC.
2. Main power ON/OFF
3. Main power fuses
2 x 800mA T
4. Main power inlet
100- 240 Vac, 50/60 Hz
5. Grounding screw
A functional ground for connecting DUT to ground when needed.
6.3. Top of ZR module
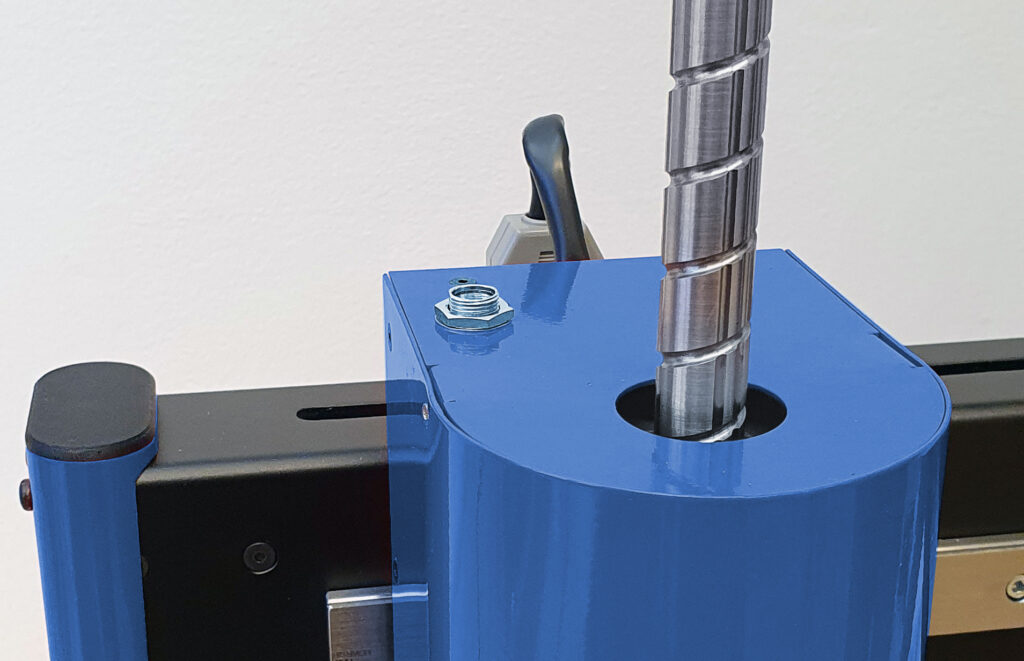
Connector for Laser Distance Meter (opt. SLDM)
6.4. Bottom of ZR module
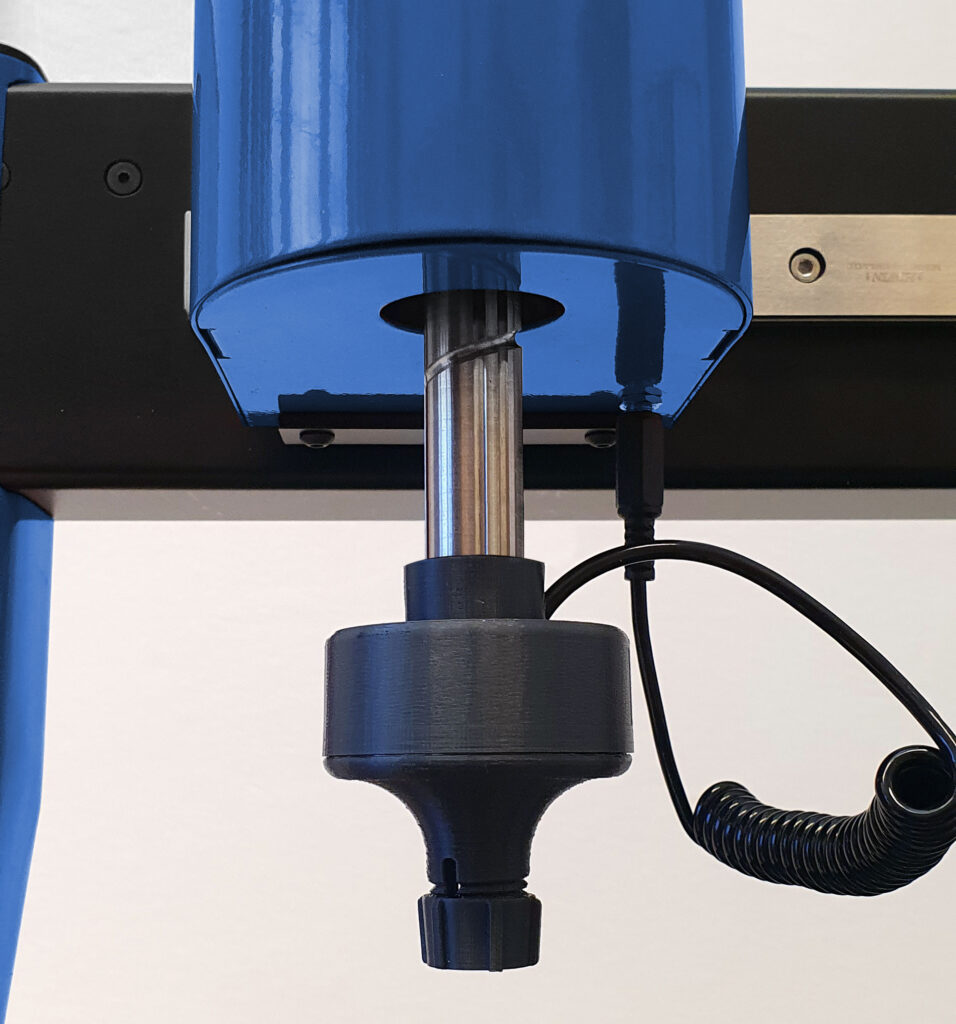
Connector for crash switch
7. Installation
7.1. A complete EMC Scanner setup consists of:
- EMC Scanner (included)
- Spectrum analyzer
- Near field probe
- Pre-amplifier
- Means for communication with the spectrum analyzer. If GPIB is required then National Instruments GPIB adapter
- PC with windows 10
- Detectus Scanning Software
7.2. Copyright
Information in this section is subject to change without notice and does not represent a commitment on the part of Detectus AB. The software, which includes information contained in any database, described in this document is furnished under the license agreement or nondisclosure agreement and may be used or copied only in accordance with the terms of that agreement. It is against the law to copy the software except as specifically allowed in the license or nondisclosure agreement. No part of this manual may be reproduced or transmitted in any form or by any means, electronic or mechanical, including photocopying and recording, for any purpose without the express written permission of Detectus AB.
© Copyright 1994 – 2021 Detectus AB. All rights reserved.
7.3. Before installing the software
Make sure that the PC complies with system requirements. (See technical data on page 5.)
If applicable, make sure that the GPIB-adapter is properly installed and that the diagnostic program provided by National Instruments confirms its functionality.
7.3.1. Installing the Software
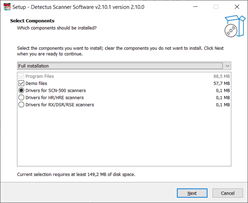
1. Insert the USB stick provided with the EMC Scanner into the computer.
2. Run setupDD.exe on the USB stick.
3. Follow the instructions on the screen and select the drivers that suit your Scanner model. Demo files are optional.
7.4. Installing the Hardware
- Unplug the PC and Scanner from the power.
- Connect the RS-232 or USB cable between the PC and the Scanner.
- Connect the power, and then switch on the PC and the Scanner.
7.5. Setting up NI Visa and instruments with GPIB
Some spectrum analyzer drivers in DSS and all drivers for signal generators and EDDs are using National Instruments Visa. Therefore, it is required to install the NI Visa driver first. NI Visa, and instructions how to install it, can be downloaded at www. ni.com. Click Support and then NI Visa…
Below are step-by-step instructions how to connect Detectus DSS running on a Windows 7 PC to a Visa compatible instrument using GPIB.
1. Open National Instruments Measurement & Automation
2. Click on your GPIB adapter in the tree view.

If you don’t see your GPIB adapter in the tree view then you need to install and configure it. Follow NI installation guidelines.
3. Click on “Scan for Instruments”
4. Now you should see your instrument at the bottom of the screen.

It is very important that you can see you’re your instrument in this list because otherwise DSS will not be able to connect to it.
7.6. Setting up NI Visa and instruments with LAN
Some spectrum analyzer drivers in DSS and all drivers for signal generators and EDDs are using National Instruments Visa. Therefore, it is required to install the NI Visa driver first. NI Visa, and instructions how to install it, can be downloaded at www.ni.com. Click Support and then NI Visa…
Below are step-by-step instructions how to connect Detectus DSS running on a Windows 7 PC to a Visa compatible instrument using LAN in a network where IP addresses are handled by a DHCP server. That is, a regular office network. A slightly more complicated procedure for connecting via a LAN cable directly is found in appendix 2.
1. Open National Instruments Measurement & Automation
2. Click on your “Devices and interfaces” in the tree view and then click “Create New…”

3. Select “VISA TCP/IP Resource” and then click Next

4. Select “Auto-detect of LAN Instrument” and then Click Next
5. Hopefully you now see your instrument in the list.

Like this: If your instrument is found then click “Finish” and skip forward to step 8. If your instrument is NOT found then you must select “Manually specify the address information of your instrument” and then click Next.
6. Type in the IP address of your instrument and click “Validate”

7. If you typed the correct IP address and your instrument is found then you should see this message. Click OK.
8. Now you should see your instrument in the tree view.

It is very important that you can see you’re your instrument

in the tree view because otherwise DSS will not be able to connect to it.
8. Calibration
8.1. Enter Scanner axis calibration (DS series)
1. Turn the power of all system components on, and start the software by clicking on the icon on your desktop.

2. After a few seconds the following dialog box appears.

3. Click Yes to reset the Scanner. The Scanner moves to position X0, Y0, Z10 (mm).
4. Click on the Config tab.
In the Scanner box, click on the Edit button to show the next dialog box.
5. Enter the handwritten settings into your Settings dialog box.
(Only DS series) The handwritten settings are unique to your

Scanner and are only available in the printed version of the manual.
6. Click on the Save button.
8.2. GPIB address of the spectrum analyzer
1. Click on the Config tab.
In the Spectrum analyzer box, click on the Communication settings button to show the next dialog box.

2. Enter the GPIB address of your spectrum analyzer into the GPIB Address box.
3. Click on the Save button.
4. Click on the Close button.
8.3. Positional calibration of the near field probe (DS and Rx series)
1. Place the near field probe in the probe holder. If the probe does not fit you can cut one of the spare probe holders to fit your probe.
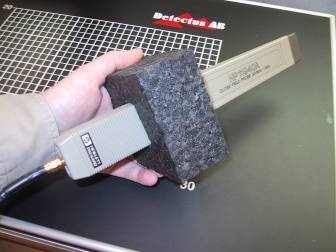
2. Carefully move the Z-axis carriage by hand downwards until the limiting position switch is activated.
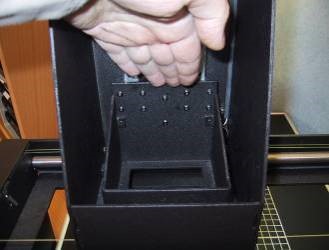
3. Place the probe holder and the probe in the Z-axis carriage (see picture). The probe should point straight down towards the Scanner.
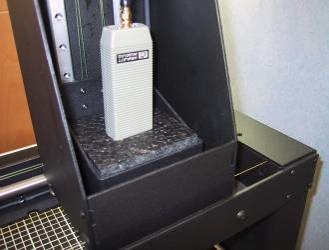
4. Carefully move the probe downwards until the tip of the probe touches the Scanner table.
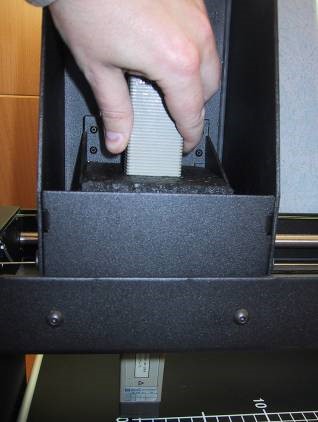
5. Move the Z-axis carriage upwards until the lower limiting position switch is released.
6. Click on the Config tab. In the Scanner box, click the Reset button.
7. Measure the distance between the center of the probe tip and the origin of the coordinates of Scanner table.
8. Click on the Config tab. In the Spectrum analyzer box, near the Probe setting, click the Edit button.

9. Adjust the values of Origin Offset X and Y with the distances measured in step 7. For DS, RX and RQ scanners, do not change the value of Origin Offset Z. It should always be 10.
10. Click on the Save button.
11. Click on the Close button.
12. Click on the Config tab. In the Scanner box, click the Reset button.
Repeat step 6 to 12 until the tip of the
8.4. Positional calibration of the near field probe (HR series)
In the Scanner table of the HR Scanner there is a built-in transmitter that emits at 120MHz from two beacons located in the upper left corner of the grid on the Scanner table.
By using the SMA connector on the left side of the Scanner table, you can connect an external signal source that emits at a different frequency.
The purpose of the beacons is to calibrate the position of the near field probes in X and Y-axis. The two beacons are designed for different types of probes.
Click on the “Calibrate to Beacon button”

1. A dialog with 8 steps will guide you through the calibration process.
Step 1 : Make sure the Scanner table is empty.

2. Step 2 : Choose and connect the internal or external calibration signal source.

3. Step 3 : This is for safety to prevent the probe from running into the Scanner table.

4. Step 4 : Click the button “Reset to machine zero”. The Scanner resets and moves down to Z=0. The Scanner table must be empty.

5. Step 5 : Lower the probe holder cylinder. An easy way to calibrate the Z-axis is to use a thickness gauge between the tip of the probe and the table.

6. Step 6
Depending on the type of near field probe being used onr of the two beacons needs to be selected.
Beacon 1 is a vertical coil that works for H-field probes that are sensitive to a vertical field typically horizontal loop probes. This beacon also works for E-field probes. Beacon 2 is two crossed horizontal wires that work for H-field probes that are sensitive to a horizontal field typically vertical loop probes.
For best performance, a vertical loop probe must be rotated
so that the plane of the loop is aligned with the X or Y-axis.

7. Step 7 : Click on the Calibrate button to start the calibration sequence.The calibration will take between one and ten minutes depending on the speed of the spectrum analyzer. When the calibration is done you will be given a choice to move the probe to X0Y0Z0. It is recommended to do so. This is a chance to verify that the probe is correctly calibrated. If the calibration was successful the tip of the probe should be position directly above X0Y0. If the calibration if off you may need to adjust the starting position of the calibration. This can be done in the advanced settings. See below.

8. Step 8
Don’t forget to disconnect the calibration signal source

Advanced settings:
Clicking on “Advanced Settings” opens the dialog shown below. With these settings you can fine tune the calibration settings

1. Side length of starting area
The Scanner will search for the beacon in smaller and smaller squares. This is the size of the first big square.
Default value is 3.2mm
2. No. of avg. meas. / position
These are the number of measurements made at each measuring position, from which the average value is calculated. More measurements will give a more accurate result but will take longer. Default value is 10 measurements.
3. Center frequency (Int. beacon)
This is the frequency that will be measured when selecting Internal beacon in step 2 above. Default value is 120MHz
4. Center frequency (Ext. beacon)
This is the frequency that will be measured when selecting External beacon in step 2 above. Default value is 300MHz
5. Spectrum analyzer settings
These are the setting that will be used when searching for the beacon.
6. Start position probe type 1
These are the coordinates of the point around which we will start to search for the beacon when type 1 is selected in step 6 above.
7. Start position probe type 2
These are the coordinates of the point around which we will start to search for the beacon when type 2 is selected in step 6 above.
8. Return to factory settings
Click here to return to factory default settings.
8.5. Positional calibration of the near field probe (SCN-500 series)
1. Make sure the scanner table is empty.
2. Reset the scanner.

3. After reset you will get the choice to adjust the height of the probe. Click Yes.

4. Make sure that the probe is mounted heigh enough, or just remove the probe to be extra safe, before clicking OK to move down.

5. Lower the probe untill it almost touches the scanner table and fasten it.

6. Now the height (Z axis) of the probe is set.
7. If the tip of the probe is not located at the origin of coordinates then the origin offset values need to be adjusted.
8. Measure the distance between the center of the probe tip and the origin of the coordinates of Scanner table.
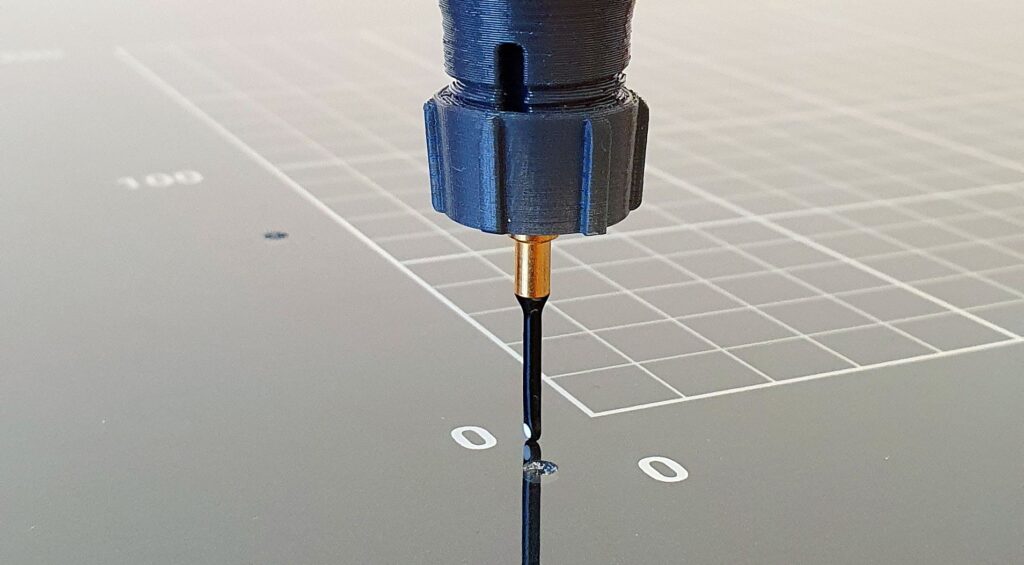
9. Click on the Config tab.
In the Spectrum analyzer box, near the Probe setting, click the Edit button.

10. Adjust the values of Origin Offset X and Y with the distances measured in step 8.
Please note! The value for Origin Offset Z is not in use for SCN-5xx series and must be set to zero.
11. Click on the Save and then the Close button.
12. Reset the scanner by repeating steps 2 – 4
13. Repeat step 8 to 12 until the tip of the probe is positioned above the origin of coordinates after a reset.
8.6. Laser Distance Meter (LDM) of SCN-500 series of EMC Scanners
The LDM is measuring the topography of a DUT using laser triangulation to create a 3D model (STL) that can be used to measure emission or immunity with the SCN-500 series of EMC Scanners.
The LDM is sending a laser beam straight down projecting a red dot on the surface of the DUT. A slightly angled camera built into the LDM registers the position the laser dot and the height is calculated by triangulation.
The LDM is attached on the left side of the ZR module of the SCN-500 EMC Scanner and connected at the top.

8.6.1. Preparations:
Before we begin calibration the position of the LDM we must make sure that the probe is properly calibrated to the coordinate grid. This can be done either manually or with the help of the Beacon calibration option.


8.6.2. Measuring the position of the LDM:
For the LDM to work properly it need to be calibrated in position. That is, the offset in X and Y of the laser beam compared to the probe must be typed into the software.
Measure the offset like this:
1. Go to Measuring Points tab – 3D.
2. Turn the laser on by checking LDM ON.
3. Click “Position Scanner manually” to open the positioning dialog.
4. Move the scanner head using the step-by-step movement buttons until the red laser dot is at the origin of coordinates.
5. Remember the X and Y position.
6. Turn the laser off.

8.6.3. Enter the LDM offset coordinates:
Enter the LDM offset coordinates:
1. Go to Config tab and click the Scanner Edit button.
2. Type in the reversed coordinates from the positioning dialog.
3. Click Save and then Close.

8.6.4. Measuring the topography of a DUT:
1. Place the DUT on the scanner table. Keep in mind that there is an area to the right where the laser cannot reach due to its position on the side of the probe.

2. Go to Meas. Points tab – 3D.
3. Enter the coordinates for an area that covers the DUT.
4. Enter the step size.
5. Click the button “Measure heights using LDM”.
6. Enter a filename for the 3D model in the “Save As” dialog that opens.
7. The scanning will begin.

8. When the scanning is done you can load the 3D model and it probably looks fairly good from the top view.

9. However, depending on the shape of the DUT and if the laser dot was blocked from the view of the camera, there may be some points where we have no good reading. If so, those points will show as unreasonably heigh spikes.

10. The feature “Auto correct heights” will find the points with bad readings and try to correct them by approximation from the surronding points.
11. Clicking “Auto correct heights” will open a “Save As” dialog and it is recommended to choose a different name and not overwrite the original 3D model just in case…

8.6.5. Tip:
Sometimes it is impossible to completely avoid bad readings because of the shape of the DUT but it is possible to reduce the number points in a few easy ways.
• Rotate the DUT so that steep edges are facing in the Y+ direction.
• Cover deep holes with non transparent tape.
• Cover shiny parts with non transparent tape.
8.7. Entering the amplitude correction factors of the near field probe
You can calibrate your probe, Pre-amp and cables automatically and accurately using Detectus Strip line calibration board and the self-explaining wizard found on the Config tab. The Strip line calibration board is sold separately and requires a spectrum analyzer with built-in tracking generator. Make sure the scanner table is empty.
1. Click on the Config tab.
In the Spectrum analyzer box, near the Probe setting, click the Edit button.

2. Enter a new name for the probe setting in the Probe text box. Please note that the name must begin with PROBE_.

3. Click the … button to edit the Correction factors.
Enter the frequency in Hz, kHz, MHz or GHz. Enter the amplitude correction in dB.

4. Click on the OK button.
5. Click on the Close button.
8.8. Positional calibration of the IRprobe (DS, and Rx series)
1. Place the IR-probe in the Z-axis carriage. The probe should point straight down towards the Scanner.
2. Click on the Config tab.
In the Scanner box, click the Reset button.
3. Press the LASER ON button on top of the IR-probe.
A diode will light a red spot on the Scanner for app. 15 seconds.
4. Measure the distance between the light spot and the origin of coordinates of the Scanner table.
5. Click on the Config tab.
In the Spectrum analyzer box, near the Probe setting, click the Edit button.

6. Adjust the values of Origin Offset X and Y with the distances measured in step 4. For DS, RX and RQ scanners, do not change the value of Origin Offset Z. It should always be 10.
7. Click on the Save button.
8. Click on the Close button.
9. Click on the Config tab. In the Scanner box, click the Reset button.
10. Repeat step 2 to 9 until the light spot is positioned at the origin of coordinates after a reset.
8.9. Calibrating the temperature reading of the IR-probe (DS and Rx series)
To be able to perform the calibration, you need two surfaces of different temperatures. A big difference in temperature between the two surfaces will generate a better result than a small difference in temperature. The temperatures of the surfaces need to be fairly stable during the calibration process.
8.9.1. Calibrating the temperature (°C) reading of the IR-probe is done in three steps:
1. Setting calibration factors to default values.
2. Calculating the calibration gain.
3. Calculating the calibration offset.
8.9.2. Setting calibration factors to default values
1. Click on the Config tab. In the Scanner box, click on the Edit button to show the next dialog box.

2. Make sure that the Heat calibration gain is set to 2.22 and that the Heat calibration offset is set to 0 (zero).
3. Click on the Save button.
4. Click on the Close button.
8.9.3. Calculating calibration gain
1. Point the IR-probe towards a surface with a low constant temperature, e.g. the black surface on top of the Scanner table.
2. Click on the Meas. Heat tab.
3. In the Measure Continuously box, click on the button Measure Now button.

4. Make notes on the temperature reading on the screen and the temperature reading on the LCD display of the IR-probe.
5. Now point the IR-probe towards a surface with a high constant temperature.
6. Make notes on the temperature reading on the screen and the temperature reading on the LCD display of the IR-probe.
7. Calculate the new calibration gain using this formula: SCR1 = Low temperature shown on the screen.
LCD1 = Low temperature shown on the LCD display of the IR-probe.
SCR2 = High temperature shown on the screen.
LCD2 = High temperature shown on the LCD display of the IR-probe.
New calibration gain = (LCD2 – LCD1)/ (SCR2 – SCR1)*Old calibration gain
8. Cick on the Config tab.
In the Scanner box, click on the Edit button to show the next dialog box.

9. Enter the new Heat Calibration gain
10. Click on the Save button.
11. Click on the Close button.
12. Repeat the procedure until (LCD2 – LCD1)/ (SCR2 – SCR1) is near one.
8.9.4. Calculating calibration offset
1. Point the IR-probe towards a surface with a constant temperature, e.g. the black surface on top of the Scanner table.
2. Click on the Meas. Heat tab.
3. In the Measure Continuously box, click on the button Measure Now button.

4. Make notes on the temperature reading on the screen and the temperature reading on the LCD display of the IR-probe.
5. Calculate the new offset factor using this formula:
SCR = temperature shown on the screen.
LCD = temperature shown on the LCD display of the IR-probe
New calibration offset = LCD – SCR + old calibration offset.
6. Click on the Config tab.
In the Scanner box, click on the Edit button to show the next dialog box.

7. Enter the new Heat Calibration gain.
8. Click on the Save button.
9. Click on the Close button.
10. Repeat the procedure until the temperature reading on the screen and the temperature reading on the LCD display of the IR-probe are equal.
8.9.5. Changing the heat emission factor of the IR probe
The emission factor is the rate of energy emitted from the surface of the object in front of the probe. All objects possess a particular emission factor which changes according to the object’s conditions or temperature. Since the probe allows the emission factor to be set, even more precise measurements can be conducted by matching the emission factor of the object to be measured.
Objects with a low emission factor (e.g the surface of shiny metallic objects) reflect the surrounding temperature since they are reflective. In this case, it is necessary to block out these effects from the surrounding objects since incorrect measurements will result by reflecting these temperatures.
The emission factor normally has a maximum value of 1.00. However, taking into consideration the influence of the surrounding noise, the emission factor of the probe can be set up to 1.20.
8.9.6. This is how to change the emission factor of the probe:
1. Unscrew and remove the cover.

2. Press the enter button to enter setup mode. The button will light red.

3. Press arrow buttons until the cursor on the display is above the “ε”

4. Press the enter button to select the emissivity setting mode.
5. Press the arrow buttons to adjust the emission factor.
6. Press the enter button to exit the emissivity setting mode.
7. Press the enter button to exit the setup mode.
8. Mount to cover.
9. How to …
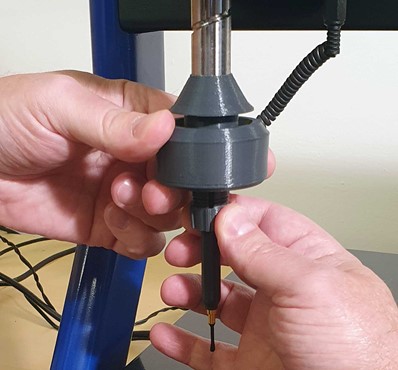
9.1. How to mount the probe - SCN-500 series
Connect the RF cable to the probe and tighten the nut firmly. It is very important that the nut is firmly tighten because of the rotation forces that will occur during four axis measurements.
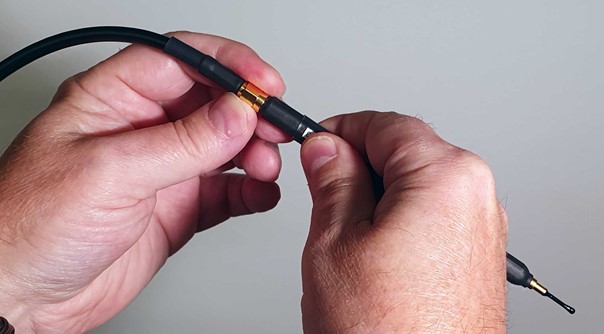
Insert the probe from the top of the Z axis.
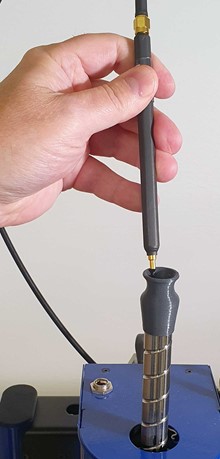
Fasten the probe by tightening the nut firmly.
9.2. How to mount the ZR module - SCN-500 series
In the package with the SCN-500 EMC Scanner there is a small plastic bag with three screws and an Allen key. Those are for mounting the ZR module.

Mount the ZR module and fasten it with the upper screw first. Then fasten the two screws a the bottom.
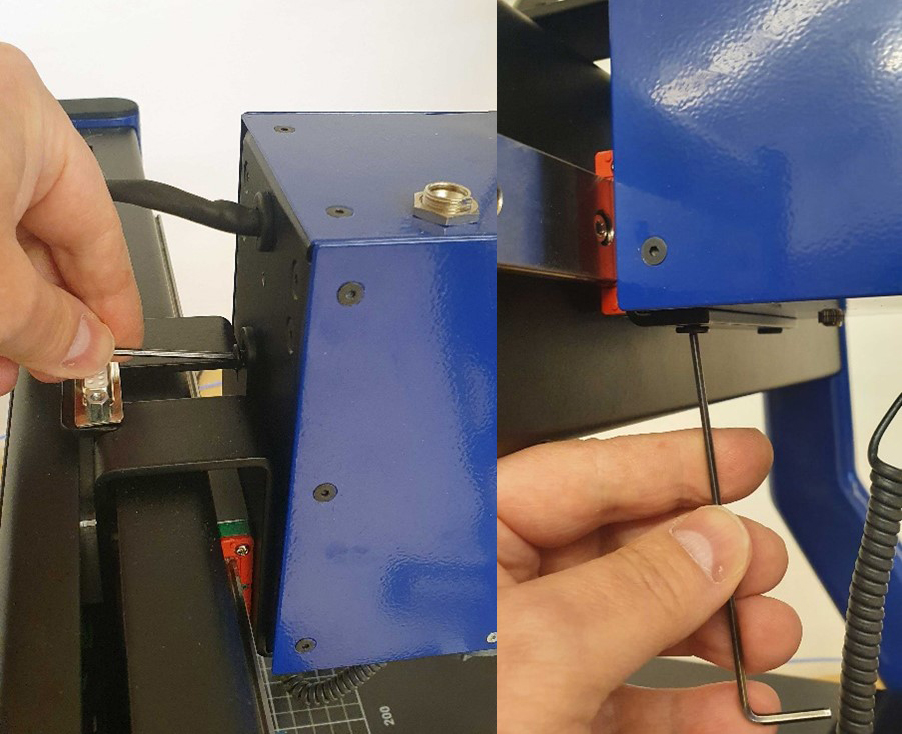
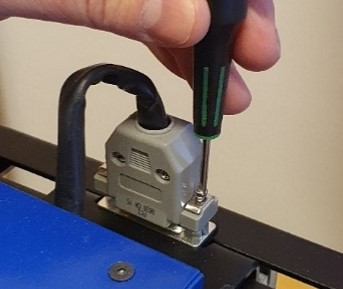
Connect the 15-pin D-SUB and secure it with the two screws. Use a regular flat head screwdriver.
Connect the probe holder to the ZR module.

9.3. How to perform Pre-Scan and EMC-Scan measurements
This chapter will guide you through, step by step, how to perform a simple EMC-Scan measurement step by step.
1. Start the software by clicking on the icon on your desktop.

2. After a few seconds, this dialog box will show.

3. Click on Yes to reset the Scanner to its starting.
4. Position and calibrate the near field probe according to the procedure in “Positional calibrating the near field probe”.
5. Make sure that the near field probe is connected to the spectrum analyzer (possibly via a pre-amplifier) and that all instruments are powered on.
6. Click on the Config tab.

7. In the Spectrum analyzer box, near Setting, click on the Edit button. This is the Settings dialog box.

8. Click on the ”down arrow” on the right side of the Setting box and select a suitable setting from the list showing all stored settings. If no suitable setting is found, you may enter a new setting name and alter the settings to suit.
9. Click on the Save button.
10. Click on the Close button.
11. Click on the Config tab.
In the Spectrum analyzer box, near the Probe setting, click on the Edit button.
12. Click on the ”down arrow” on the right side of the Probe box and select a suitable setting from the list showing all stored settings. If no suitable setting is found, you may enter a new setting name and alter the settings to suit. (Refer to “Entering the amplitude correction factors of the near field probe”).

13. Click on the Save button.
14. Click on the Close button.
15. Place the test object on the Scanner table.
16. Click on the Meas. points tab.
17. Click on the General button to select 2.5 dimensional measuring points. It is also possible to generate full 3D measuring points. See “How to generate 3D measuring points” for a detailed description.
18. In the Grid / Point list box, select Grid.

19. Enter a suitable step size in the Step size box.
A small step size will generate a high-resolution measurement and a large step size will generate a low-resolution measurement.
Measuring in large steps is quicker than measuring in small steps.
20. Select measuring plane by clicking on XY plane, XZ plane or YZ plane.
21. Click on the Outline button.
Define the outline of the test object by entering values in the Area box. You may also click and draw the outline. Drawing the outline is optional, but may be valuable when you want to repeat a measurement.
22. Click on the Base level button.
Define the measuring area by entering values in the Area box. You may also click and draw the area.
23. Enter the value of Z-level in the Area box.
Z- level is the height of the probe above the Scanner table during measurement.
24. You may define “islands” with different Z-levels than the Base level by clicking on Level 1 … Level 7 buttons. This is useful e. g. to make the probe skip over high components on a PCB.
25. The measuring point can be saved (as an .MP file) for later use by clicking on the Save button.
26. Click on the Meas. EMC tab

27. Click on the Pre-Scan button to start the wide-band measurement. (The setting for this measurement was defined in step 6.)
When the measurement is finished, you will see the spectra and a list of peaks.
28. Click on the Save button to save the measurement.
(Saving is optional, but you will find it useful when you want to repeat a measurement and compare the results.)
29. Select the desired frequencies from the list of Scanned frequencies and click on the Add => button to move the frequencies into the list of Frequencies to measure.
Other ways of entering a frequency into the list of Frequencies to measure, are by double-clicking on the spectra graph or simply by typing the frequency into the Add manually box and clicking on the Add button next to it.

30. Click on the EMC-Scan button to start the narrow-band measurement of the selected frequencies. (The setting for this measurement was defined in step 6.)
31. Before the measurement is started, you will have to enter where to save the result as one or more files.

32. Enter the desired file name.
You do not have to enter the file extension because the files will automatically be named .E01 for the first frequency, .E02 for the second frequency and so on. The measuring results stored in these files can be visualized on the View Scan tab.
33. Click on the View Scan tab.


34. There are many ways to visualize the result of an EMC-Scan measurement, utilizing the features on the View Scan tab. For detailed information, please refer to page 131.
35. The result of an EMC-Scan measurement can be documented as a report in HTML format and printed out.

9.4. How to perform a Multi-Scan measurement
This chapter will guide you through, step by step, how to perform a simple EMC-Scan measurement step by step.
1. Start the software by clicking on the icon on your desktop.

2. After a few seconds, this dialog box will show.

3. Click on Yes to reset the Scanner to its starting position.
4. Position and calibrate the near field probe according to the procedure in “Positional calibrating the near field probe”.
5. Make sure that the near field probe is connected to the spectrum analyzer (possibly via a pre-amplifier) and that all instruments are powered on.
6. Click on the Config tab.

7. In the Spectrum analyzer box, near Setting, click on the Edit button. This is the Settings dialog box.

8. Click on the ”down arrow” on the right side of the Setting box and select a suitable setting from the list showing all stored settings. If no suitable setting is found, you may enter a new setting name and alter the settings.
9. Click on the Save button.
10. Click on the Close button.
11. Click on the Config tab.
In the Spectrum analyzer box, near the Probe setting, click on the Edit button.
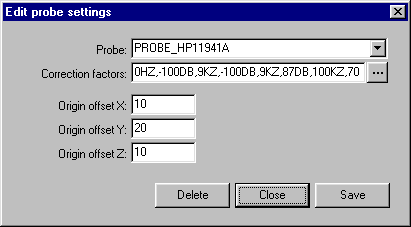
12. Click on the ”down arrow” on the right side of the Probe box and select a suitable setting from the list showing all stored settings. If no suitable setting is found, you may enter a new setting name and alter the settings to suit. (Refer to “Entering the amplitude correction factors of the near field probe”).
13. Click on the Save button.
14. Click on the Close button.
15. Place the test object on the Scanner table.
16. Click on the Meas. points tab.
17. Click on the General button to select 2.5 dimensional measuring points. It is also possible to generate full 3D measuring points. See “How to generate 3D measuring points” for a detailed description.
18. In the Grid / Point list box, select Grid.

19. Enter a suitable step size in the Step size box.
A small step size will generate a high-resolution measurement and a large step size will generate a low-resolution measurement.
Measuring in large steps is quicker than measuring in small steps.
20. Select measuring plane by clicking on XY plane, XZ plane or YZ plane.
21. Click on the Outline button.
Define the outline of the test object by entering values in the Area box. You may also click and draw the outline. Drawing the outline is optional, but may be valuable when you want to repeat a measurement.
22. Click on the Base level button.
Define the measuring area by entering values in the Area box. You may also click and draw the area.
23. Enter the value of Z-level in the Area box.
Z- level is the height of the probe above the Scanner table during measurement.
24. You may define “islands” with different Z-levels than the Base level by clicking on Level 1 … Level 4 buttons. This is useful e. g. to make the probe skip over high components on a PCB.
25. The measuring point can be saved (as an .MP file) for later use by clicking on the Save button.
26. Click on the Meas. EMC tab

27. Click on the Multi-Scan button to start the wide-band measurement. (The setting for this measurement was defined in step 7.)
Before the measurement is started, you will have to enter the location to save the result as one or more files.

28. Enter the desired file name.
You do not have to enter the file extension because the files will automatically be named .MS2D. The measuring results stored in this file can be visualized on the View Scan tab
29. Click on the View Scan tab.

30. Change the search criteria at the bottom in the format box so that you can see the Multi-Scan files.


31. There are many ways to visualize the result of a Multi-Scan measurement by utilizing the features on the View Scan tab. For detailed information, please refer to page 131.
32. The result of an Multi-Scan measurement can be documented as a report in HTML format and printed out.

9.5. How to perform a Heat-Scan measurement (DS and Rx series)
This chapter will guide you, step by step, through a simple Heat-Scan measurement step by step.

1. Start the software by clicking on the icon on your desktop.

2. After a few seconds this dialog box will show.
3. Click on Yes to reset the Scanner to its starting position at coordinates X0 Y0 Z10.
4. Position and calibrate the IR-probe according to the procedure in “Positional calibration of the IR-probe against Scanner”.
5. Click on the Meas. points tab.
6. Click on the General button to select 2.5 dimensional measuring points. It is also possible to generate full 3D measuring points. See “How to generate 3D measuring points” for a detailed description.
7. In the Grid / Point list box, select Grid.

8. Enter a suitable step size into the Step size box.
A small step size will generate a high-resolution measurement and a large step size will generate a low-resolution measurement.
Measuring in large steps is quicker than measuring in small steps.
9. Select the desired measuring plane by clicking on XY plane, XZ plane or YZ plane.
10. Click on the Outline button.
Define the outline of the test object by entering values into the Area box. You may also click and draw the outline. Drawing the outline is optional, but you will find it useful when you want to repeat a measurement.
11. Click on the Base level button.
Define the measuring area by entering values into the Area box. You may also click and draw the area.
12. Enter the value of Z-level into the Area box.
Z- level is the height of the probe above the Scanner table during measurement.
13. You may define “islands” with different Z-levels than the Base level, by clicking on the Level 1 … Level 4 buttons. This is useful e.g. to make the probe skip over high components on a PCB.
14. The measuring points can be saved (as .MP files) for later use by clicking on the Save button.
15. Click on the Meas. Heat tab.

16. Click on the Heat-Scan button to start the measurement.
17. Before the measurement is started, you will have to enter the location to save the result file.

18. Enter the desired file name.
You do not have to enter the file extension because the file will automatically be named .T01. The measuring results stored in these files can be visualized on the View Scan tab.
19. Click on the View Scan tab.


20. There are many ways to visualize the result of a Heat-Scan measurement by utilizing the features on the View Scan tab. For detailed information, please refer to page 131.
21. The result of a Heat-Scan measurement can be documented as a report in HTML format and printed out.

9.6. How to perform a Pre-Scan measurement on specified positions (DS and Rx series)
This chapter will guide you step by step through a Pre-Scan measurement on specified positions.
1. Start the software by clicking on the icon on your desktop.

2. After a few seconds this dialog box will show.

3. Click on Yes to reset the Scanner to its starting position at coordinates X0 Y0 Z10.
4. Position and calibrate the near field probe according to the procedure in “Positional calibration of the near field probe”.
5. Make sure that the near field probe is connected to the spectrum analyzer (possibly via a pre-amplifier) and that all instruments are powered on.
6. Click on the Config tab.

In the Spectrum analyzer box, near Setting, click on the Edit button.

7. Click on the ”down arrow” on the right side of the Setting box and select a suitable setting from the list showing all stored settings. If no suitable setting is found, you may enter a new setting name and alter the settings.
8. Click on the Save button.
9. Click on the Close button.
10. Click on the Config tab.
In the Spectrum analyzer box, near the Probe setting, click on the Edit button.

11. Click on the ”down arrow” on the right side of the Probe box and select a suitable setting from the list showing all stored settings. If no suitable setting is found, you may enter a new setting name and alter the settings to suit you. (Refer to “Entering the amplitude correction factors of the near field probe”).
12. Click on the Save button.
13. Click on the Close button.
14. Place the test object on the Scanner table.
15. Click on the Meas. points tab.
16. Click on the General button to select 2.5 dimensional measuring points. It is also possible to generate full 3D measuring points. See “How to generate 3D measuring points” for a detailed description.

17. In the Grid / Point list box, select Point list.
18. In the Point list box, click on the Pick button.
19. Pick a desired number of points by clicking on the grid.
A dialog box will ask you to enter the Z-level of each point.
20. The measuring points can be saved (as .MP files) for later use by clicking on the Save button.
21. Click on the Meas. EMC tab.

22. Click on the Pre-Scan button to start the wide-band measurement.
(The setting for this measurement was defined in step 6. When the measurement is finished the spectra graph and a list of peaks are displayed.
23. Click on the Save button to save the measurement as a .PRE file.
24. Click on the View Pre-Scan tab.

25. Click on the Load button and select the previously saved file.
26. For detailed information on how to operate the View Pre-Scan tab, please refer to table of contents.
27. The result of a Pre-Scan measurement can be documented as a report in HTML format and printed out.

9.7. How to perform a spot Heat measurement over a period of time (DS and Rx series)
This chapter will guide you step by step through the heat measurement of a spot during a period of time.
1. Start the software by clicking on the icon on your desktop.

2. After a few seconds, this dialog box will show.

3. Click on Yes to reset the Scanner to its starting position at coordinates X0 Y0 Z10.
4. Position and calibrate the IR-probe according to the procedure in “Positional calibration of the IR-probe”.
5. Click on the Meas. Heat/Time tab.

6. Enter the desired coordinates into Scanner Position (mm) box, and click on the Go button to move the Scanner and aim the IR-probe towards the spot to be measured.
7. Verify the position of the IR-probe by pressing the LASER ON button on top of the IR-probe. (The laser will light for approximately 15 seconds.)
8. In Measurement Preferences enter the total measuring time in the Time box.
9. In Measurement Preferences enter the interval desired between the individual measurements in the Interval box.
10. In the Active Layer box, select a colored layer.
11. Start the measurement by clicking on the Start button.
12. When the measurement is finished you can click on the Save button to save the measurement as a .HOT file.
(Saving is optional but you will find it useful when you want to repeat a measurement and compare the results.
9.8. How to perform a spot EMC measurement over a period of time
This chapter will guide you, step by step, through making a spot EMC measurement over a period of time.
1. Start the software by clicking on the icon on your desktop.

2. After a few seconds, this dialog box will show.

3. Click on Yes to reset the Scanner to its starting position at coordinates X0 Y0 Z10.
4. Position and calibrate the IR-probe according to the procedure in “Positional calibration of the IR-probe”.
5. Click on the Meas. EMC/Time tab.

6. Enter the desired coordinates into Scanner Position (mm) box, and click on the Go button to move the Scanner and place the near field probe above the spot you want to measure.
7. In Measurement Preferences enter the total measuring time in the Time box.
8. In Measurement Preferences enter the desired frequency in the Frequency box. Allowed units are Hz, kHz, MHz and GHz.
9. In the Active Layer box, select a colored layer.
10. Start the measurement by clicking on the Start button.
11. When the measurement is finished you can click on the Save button to save the measurement as a .EOT file.
(Saving is optional but you will find it useful when you want to repeat a measurement and compare the results.)
9.9. How to generate 3D measuring points
3D measuring points are based on a 3D surface model in STL file format.
The measuring points are generated to form an offset surface to the STL file.
1. Click on the Meas. points tab.

2. Click on the OPEN button to open an STL-file. Both ASCII and Binary STL-files are supported.

3. The STL-file view can be rotated, zoomed and panned

4. Click on the STL alignment button.
Make sure the 3D model (STL-file) is aligned with the physical object on the scanner table by using the STL-alignment feature described in detail on page 103.
5. Set up the scanning area

6. Click on the Generate MP3D button to generate the measuring points.
Generation may take some time if the 3D model is complex. A blue bar will show the progress.
Generation can be stopped by clicking again on the same button.

9.10. How to make calculations
On the Calculate tab, you can perform four different calculations based on measurements. The calculations are as follows:
1. Concatenate EMC-Scan measurements is a vector addition, measuring point by measuring point, of two previously saved EMC-Scan measurements. T h i s calculation is intended to eliminate the irregular appearence of the appearance of a measured field, caused by the difference in sensitivity in different angles of a dipole antenna. Perform a measurement, turn the antenna (probe) 90° and perform another measurement, then concatenate the two measurements.

2. Subtract EMC-Scan or Heat-Scan measurements is a subtraction, measuring point by measuring point, of two previously saved EMC-Scan or Heat-Scan measurements. This calculation is intended to visualize the difference between two EMC-Scan or two Heat-Scan measurements. For example, one measurement performed before and one after an alteration to the test object.
3. Subtract Pre-Scan measurements is a subtraction of two previously saved Pre-Scan measurements.
This calculation is intended to visualize the difference between two Pre-Scan measurements. For example, one measurement performed before and one after an alteration to the test object.
4. Subtract Heat/Time measurements is a subtraction of two previously saved Heat/Time measurements.
This calculation is intended to visualize the difference between two Heat/Time measurements. For example, one measurement performed before and one after, an alteration to the test object.
5. Subtract EMC/Time measurements is a subtraction of two previously saved EMC/Time measurements.
This calculation is intended to visualize the difference between two EMC/Time measurements. For example, one measurement performed before and one after an alteration to the test object.
9.10.1. Lin/Log
Activating Lin/Log means that the calculation is performed in linear mode instead of logarithmic mode.
That is, all values are first converted from logarithmic mode to linear mode then the calculation is performed and then the result of the calculation is converted back to logarithmic mode.
Please note!
A negative linear result cannot be converted to log mode.
To resolve that the minus sign is removed before converting to log mode and then added to the result after conversion.
To make a calculation, do as follows:


Click on the Calculate button to perform the calculation.
The resulting file can now be visualized on the corresponding View tab.
10. Reference manual
10.1. How the Pre-Scan measurement is performed in detail
- The Scanner moves to the first measuring position.
- The spectrum analyzer is reset
- Basic settings are transferred to the spectrum analyzer
- The spectrum analyzer is set to max hold mode.
(Max hold means that the highest amplitude at each frequency is kept.) - The spectrum analyzer takes a number of sweeps.
- The Scanner moves to the next measuring position.
- Steps 5 to 6 are repeated until all measuring positions are measured.
- The frequency and amplitude of all peaks are acquired.
(The spectrum analyzer decides what is a peak and what is not.) - The trace is acquired.
- The Scanner moves to its starting position.
10.2. How the Scan measurement is performed in detail
- The spectrum analyzer is reset.
- The Scanner moves to the first measuring position.
- Basic settings are transferred to the spectrum analyzer.
- The spectrum analyzer zooms in on the first selected frequency.
- The spectrum analyzer is set to max hold mode.
(Max hold means that the highest amplitude at each frequency is kept.) - The spectrum analyzer takes a number of sweeps.
- The frequency and amplitude of the highest peak is acquired.
- Max hold mode is cleared.
- The spectrum analyzer zooms in on the next selected frequency.
- Steps 5 to 9 are repeated until all frequencies are measured.
- The Scanner moves to the next measuring position.
- Steps 5 to 11 are repeated until all measuring positions and frequencies are measured.
- The Scanner moves to its starting position.
10.3. How the Multi-Scan measurement is performed in detail
Basically, a Multi-Scan measurement is a series of Pre-Scan measurements, one in every measuring position.
From these Pre-Scan measurements field plots similar to Scan measurements, are generated. So when viewing the result from a Multi-Scan measurement any frequency can be chosen to look at in detail.
- The spectrum analyzer is reset
- The Scanner moves to the first measuring position.
- Basic settings are transferred to the spectrum analyzer
- The spectrum analyzer is set to max hold mode.
(Max hold means that the highest amplitude at each frequency is kept.) - The spectrum analyzer takes a number of sweeps.
- The trace data is transferred to the software.
- Max hold mode is cleared.
- The Scanner moves to the next measuring position.
- Steps 4 to 8 are repeated until all measuring positions are measured.
- The Scanner moves to its starting position.
10.4. How the Immunity-Scan measurement is performed in detail
An Immunity-Scan is, very much lika a Multi-Scan measurement, only we measure immunity and not emission.
- The signal generator (SG) and the Error Detection Device (EDD) is reset
- Basic settings are transferred to the SG and the EDD
- The Scanner moves to the first measuring position.
- The lowest frequency and amplitude is sent to the SG.
- Wait for a while (dwell time) to let the DUT react.
- Measure DUT failure using the EDD and the Detection sequence.
- If the DUT does not fail we increase the amplitude and measure again for DUT failure until the DUT fails or we reach the highest amplitude setting.
- Store frequency and amplitude data.
- Set the next frequency and redo from (5) until we have measured all frequencies.
- The Scanner moves to the next measuring position.
- Steps 4 to 10 are repeated until all measuring positions are measured.
- The Scanner moves to its starting position.
11. The Config tab

On this tab, you may create your own settings for Scanner, spectrum analyzer, near field probe, IR-probe, limit lines, graphics and reports. You may also use the pre-defined settings.
1. Spectrum analyzer:
From the list of spectrum analyzer drivers, choose the one that best corresponds to your hardware. If no suitable driver is found, please contact your local supplier.
Drivers marked with (Visa) requires National Instruments Visa. NI Visa and instructions how to install it can be downloaded at www. ni.com. Click Support and then NI Visa…
2. Setting
Choose from the list of available spectrum analyzer settings.
Click on the edit button (A) to edit the selected spectrum analyzer setting.

The upper part of the Edit spectrum analyser settings dialog box contains settings that are valid for both Pre-Scan and Scan measurements. In the lower part of the dialog box, the settings for Pre-Scan and Scan measurements are separated into two columns.
The only setting that is not explained in the manual of the spectrum analyzer is No. of spectrum sweeps.
The No. of spectrum sweeps is the number of sweeps made by the spectrum analyzer in max hold mode at each measuring position. Please refer to page 46 for a detailed explanation of how to perform a measurement.
2.1 To view or edit a setting, click on the Edit button (A). The dialog box shown above will open. When you have finished editing, click on the Save button to save the changes and then on Close to close the dialog box. To discard any changes, just click on the Close button.
2.2 To copy a setting, click on the Edit button (A). The dialog box shown above will open. Change the name in the upper text box labelled Setting and click on the Save button to save the setting under its new name, then click on Close to close the dialog box. To discard any changes, just click on the Close button.
2.3 To create a new setting, make a copy of a setting as described in 2.2, and edit the new setting as described in 2.1.
2.4 To delete a setting, click on the Edit button (A), to open the dialog box shown above. Click on the Delete button. (You will also have to confirm the deletion.) When the current setting is deleted, no setting is active so before you can perform a new measurement you need to select another setting.
3. Probe
Choose from a list of available probe settings.
Click on the Edit button (B) to edit the settings of the selected probe.

3.1 To view or edit a setting, click on the Edit button (B). The dialog box shown above will open. When you have finished editing, click on the Save button to save the changes and then on Close to close the dialog box. To discard any changes, just click on the Close button.
3.2 To copy a setting, click on the Edit button (B). The dialog box shown above will open. Change the name in the upper text box labelled Probe and click on the Save button to save the setting under its new name, then click on Close to close the dialog box. To discard any changes, just click on the Close button.
3.3 To create a new setting, make a copy of a setting as described in 3.2, and edit the new setting as described in 3.1.
3.4 To delete a setting, click on the Edit button (B), to open the dialog box shown above. Click on the Delete button. (You will also have to confirm the deletion.) When the current setting is deleted, no setting is active so before you can perform a new measurement, you need to select another setting.
Correction factors
The correction factor is made up of pairs of values. A pair contains a frequency and an amplitude separated by a comma. A comma also separates the pairs.
The amplitude in the correction factor will be added to the measured amplitude at the specified frequency. The amplitude between two specified frequencies will be calculated linearly.
For easier editing of the correction factors, click on the … button to open the dialog box shown below.

In this dialog box you can add, move, insert or delete frequency values and amplitude values.
The Origin offset is the distance from the position where the limiting position switch is activated to the position where the tip of the probe is at position X0,Y0. Please refer to ”Positional calibration of the near field probe”.
4. Communication settings
The settings in this dialog box cover parameters needed for the communication between the PC and the spectrum analyzer.
When you have finished editing, click on the Save button to save the changes and then on Close to close the dialog box. To discard any changes, just click on the Close button.

4.1 Board Id:
Board Id corresponds to the Interface name property of the GPIB driver settings. If the Interface name is GPIB0, Board Id should be 0. If Interface name is GPIB1, Board Id should be 1.

4.2 GPIB Address
This is where you enter the GPIB address of your spectrum analyzer.
4.3 Timeout:
Timeout is the time limit of the GPIB communication. If the processing of a command sent to the spectrum analyzer exceeds the time limit specified in Timeout, the software will stop waiting for the spectrum analyzer and continue with its next task. It is advisable to set this value to at least one minute.
5. Scanner
Select your Scanner model from the list.
Click on the Edit button (C) to edit the setting of the selected Scanner model.
When you have finished editing, click on the Save button to save the changes and then on Close to close the dialog box. To discard any changes, just click on the Close button.

5.1 Heat calibration gain:
This is the gain calibration factor of the IR-probe. Please refer to Calibrating the temperature reading of the IR-probe.
5.2 Heat calibration offset:
This is the offset calibration factor of the IR-probe. Please refer to Calibrating the temperature reading of the IR-probe.
5.3 Com port:
The number of the RS-232 port connected to the Scanner
6. Limit line
Choose from the list of previously defined limit lines. The limit lines can be used on the View Pre-Scan tab.
Click on the Edit button (E) to create or edit a limit line

6.1 To view or edit a setting, click on the Edit button (D). The dialog box shown above will open. When you have finished editing, click on the Save button to save the changes and then on Close to close the dialog box. To discard any changes, just click on the Close button.
6.2 To copy a setting, click on the Edit button (D). The dialog box shown above will open. Change the name in the upper text box labelled Setting and click on the Save button to save the setting under its new name, then click on Close to close the dialog box. To discard any changes, just click on the Close button.
6.3 To create a new setting, make a copy of a setting as described in 6.2, and edit the new setting as described in 6.1.
6.4 To delete a setting, click on the Edit button (D), to open the dialog box shown above. Click on the Delete button. (You will also have to confirm the deletion.) When the current setting is deleted, no setting is active so before you can make a new measurement you need to select another setting.
Limit line:
Type the name of a new limit line or select one that has previously been saved.
Settings:
The limit line is made up of pairs of values. A pair contains a frequency and an amplitude separated by a comma. A comma also separates the pairs.
For easier editing of the limit line, click on the … button to open the dialog box shown below.
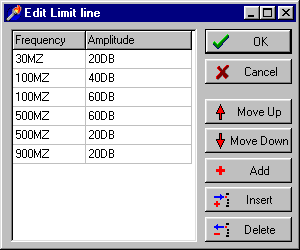
In this dialog box you can add, move, insert or delete frequency values and amplitude values.
7. Reset:
Click the Reset button to reset the Scanner to its starting position.
8. Show/Hide Advanced settings
Click on this button to show or hide the advanced setting.

8.1 Report settings, EMC:
Check the options you wish to include in the EMC reports printed from the View Scan and View Pre-Scan tabs.
8.2 Report settings, Heat:
Check the options you wish to include in the Heat reports printed from the Measure Heat/Time and View Scan tabs.

8.3 Background color, Foreground color, Trace color and Limit line color:
Click on the … button to select the foreground color of the graphics on the Measure EMC tab, the Measure Heat/Time tab, the View Scan tab and the View Pre-Scan tab.
8.4 Move measurement to origin of coordinates when loaded:
When this box is checked, measurements loaded on the View Scan tab will be moved to the origin of coordinates. You can also perform this type of transfer manually in the Edit object properties dialog box, which is accessed from the View Scan tab.
8.5 Transparent color:
Select a color that will seem transparent in the graphics on the View Scan tab.
If you want to load a bitmap containing, for example, a circuit design drawing that has a white background and black foreground. You may want the white background to be transparent so that you can see trough the drawing when it is placed above a measurement.

8.6 3D Device:
This setting decides how the software communicates with the graphics adapter of your PC. If your PC does not have a modern 3D graphics accelerator, you will only find the RGB Emulation option in the list, but if the graphics adapter supports hardware acceleration you will also find the Direct3D HAL option.
The Direct3D HAL option takes advantage of the processing capacity of your graphics adapter, and this is much faster than using the RGB Emulation option.
If you experience problems related to the 3D graphics, you may try the RGB Emulation option instead of the Direct3D HAL option.
8.7 Z-Buffer:
A big z-buffer will enable you to distinguish which of two far-away-object is in front of the other. The available options depend on your graphics adapter. It is recommended to use the highest available z-buffer depth.

8.8 Preset values in View Scan:
Check the Activate Preset box and adjust the default top and bottom value of the color palette used in View Scan tab. By default, the color palette is set up to cover the total amplitude span of the loaded measurements. By adjusting the top and bottom value of the color palette, you can focus the entire color palette to the amplitude span that you wish to examine.
8.9 Preset values in Pre-Scan, Heat/Time and EMC/Time: Check the Activate Preset box and adjust the default top and bottom value of the amplitude scale used on each tab.
8.10 Misc. settings
8.10.1 Delay before measuring. A delay, in seconds, before measuring at each measuring point.
8.10.2 Also save Multi-Scan measurements as TXT-files. Check this option to save also a TXT-file.
9. Calibrate HR Scanner to beacon
This button is only visible when HR Scanner is selected. For details refer to page 26.
12. The Meas. points – General tab
On this tab, you define the measuring points. The measuring points can either make up a grid of points or just be individual points on specified positions.
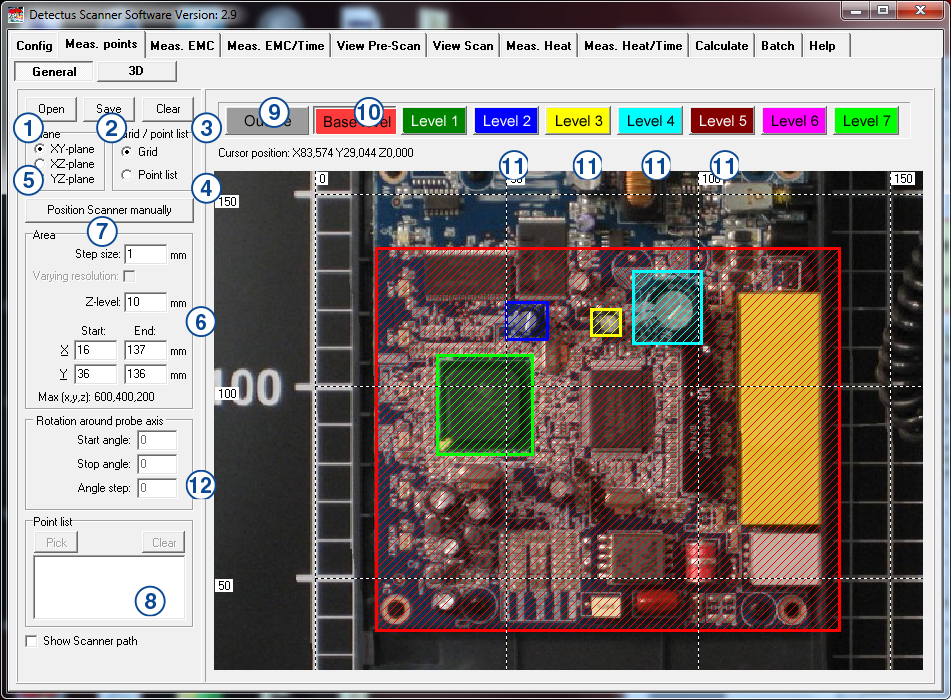
1. Open
Click here to load a previously saved set of measuring points. The files containing measuring points are named *.MP.
2. Save
Click here to save a set of measuring points to an *.MP file.
3. Clear
Click here to clear all settings on this tab.
4. Grid/Point list
The option Grid will enable you to define a grid of measuring points. The option Point list will enable you to Pick individual points for measuring.
5. Plane
Select the orientation of the measuring plane.
6. Area
In this box, you define the area, step size and height of the currently selected level. (The level is selected by clicking on one of the buttons Outline, Base level, Level 1, Level 2, Level 3 and so on)
The settings in this box are valid only when Grid is selected in the Grid/Point list box.
Start X, End X, Start Y and End Y:
These values define an area aligned with the currently selected Plane. The values can be entered either manually into the text boxes or by clicking and drawing on the graphics.
Step size:
Step size is the distance between measuring points.
A small step size will generate a high-resolution measurement and a large step size will generate a low-resolution measurement.
Measuring in large steps is quicker than measuring in small steps.
Z-level:
Z-level is the height of the probe above the Scanner table during measurement.
Varying resolution:
This is not a setting. It is just an indication that different step sizes are being used on different planes.
Point list, Pick
Click this button to activate Pick mode. (Pick mode is activated when this button appears to be pressed down and the hair-cross pointer is visible.)
When Pick mode is activated you can point and click on the graphics to pick the X and Y coordinates of a measuring point. Unless you point and click on a previously defined area, a dialog box will appear, and ask you to enter the height of the point you have just picked.
Point list, Clear
Click this button to clear the point list.
Point list
The point list can be edited manually just like an ordinary text box.
7. Position Scanner manually
Click on this button to open the form shown below:
For details please refer to page 105.

8. Show Scanner path
Check this option to show the path along which the Scanner will move during measurement.
9. Outline
Click on this button to select the Outline for editing. Edit the properties of Outline either by changing the values in the Area box, or by clicking and drawing on the graphics.
The sole purpose of Outline is to help you document the position of the test object on the Scanner table.
10. Base level
Click on this button to select the Base level for editing. Edit the properties of Base level either by changing the values in the Area box, or by clicking and drawing on the graphics.
Base level defines the area to be measured.
11. Level 1, Level 2, Level 3, and Level 4.
Click on one of the buttons to select the desired level for editing. Edit the properties of level either by changing the values in the Area box, or by clicking and drawing on the graphics.
The purpose of these levels is to make it possible to define islands of different height, so that the probe will not run into a high component.
A level with higher number has higher priority than a level with lower number. This means that if two, or more, levels coincide at a measuring position, then the height of the level with the highest number will be used.
12. Rotation around probe axis
These values define the rotation around the probe axis.
This feature is only available for Scanner models HR41 and HR43.
13. The Meas. points – 3D tab
On this tab, you define the measuring points as an offset to a 3d surface model.
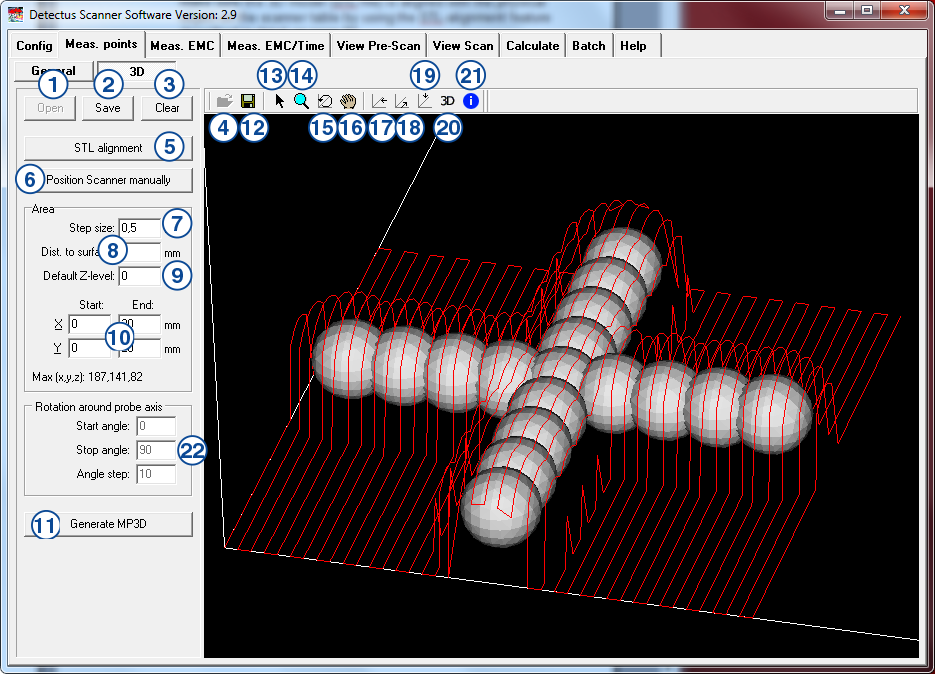
1. Open
Click here to load a previously saved set of measuring points. The files containing 3D measuring points are named *.MP3D.
2. Save
Click here to save a set of measuring points to an *.MP3D file.
3. Clear
Click here to unload MP3D and STL files.
4. Load STL file
Click here to load a 3d surface model in binary STL file format.
5. STL alignment
Click here to open the STL alignment dialog. See page 103.
6. Position Scanner manually
Click on this button to open the form shown below: For details please refer to page 105.

7. Step size
Step size is the distance between measuring points.
A small step size will generate a high-resolution measurement and a large step size will generate a low-resolution measurement.
Measuring in large steps is quicker than measuring in small steps.
8. Dist. To surface
The distance between the surface of the STL file to the measuring points.
9. Default Z-level
The height of the measuring points that are beside the STL surface model. This is the lowest possible height of a measuring point.
10. Start and stop for X and Y
These values define the measuring area in the XY-plane.
11. Generate MP3D
Click here to start generating measuring points.
12. Save STL file
Click here to save the surface model in its current position to a binary STL file.
13. Information mode
Click on this button to activate Information mode.
When Information mode is activated, the following features are available:
- a. Place the pointer on a measurement and you will see its file name along with the coordinates of the point at which you are pointing. If the measurement in question is an EMC-Scan measurement, you will also see the frequency of the highest peak.
- b. Rotate the view in 3D by keeping the left mouse button pressed down as you move the pointer.
- c. Pan the view in 3D by keeping the right mouse button pressed down as you move the pointer.
- d. Zoom in or out by turning the mouse wheel.
14. Zoom mode
Click on this button to activate Zoom mode.
When Zoom mode is activated, the following features are available:
- a. Zoom in or out by turning the mouse wheel.
- b. Zoom in or out by keeping the left mouse button pressed down as you move the pointer.
15. Rotate mode
Click on this button to activate Rotate mode.
When Rotate mode is activated, the following features are available:
- a. Rotate the view in 3D by keeping the left mouse button pressed down as you move the pointer.
- b. Zoom in or out by turning the mouse wheel.
16. Pan mode
Click on this button to activate Pan mode.
When Pan mode is activated, the following features are available:
- a. Pan the view in 3D by keeping the left mouse button pressed down as you move the pointer.
- b. Zoom in or out by turning the mouse wheel.
17. Side view
Click on this button to rotate and view the measurements from the side.
18. Front view
Click on this button to rotate and view the measurements from the front.
19. Top view
Click on this button to rotate and view the measurements from the above.
20. 3D
Click on this button to enable 3D mode.
21. Information
Click this button to show and hide the information window.
22. Rotation around probe axis
These values define the rotation around the probe axis.
This feature is only available for Scanner models HR41 and HR43.