This chapter will guide you step by step through a Pre-Scan measurement on specified positions.
1. Start the software by clicking on the icon on your desktop.
2. After a few seconds this dialog box will show.
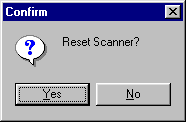
3. Click on Yes to reset the Scanner to its starting position at coordinates X0 Y0 Z10.
4. Position and calibrate the near field probe according to the procedure in “Positional calibration of the near field probe”.
5. Make sure that the near field probe is connected to the spectrum analyzer (possibly via a pre-amplifier) and that all instruments are powered on.
6. Click on the Config tab.
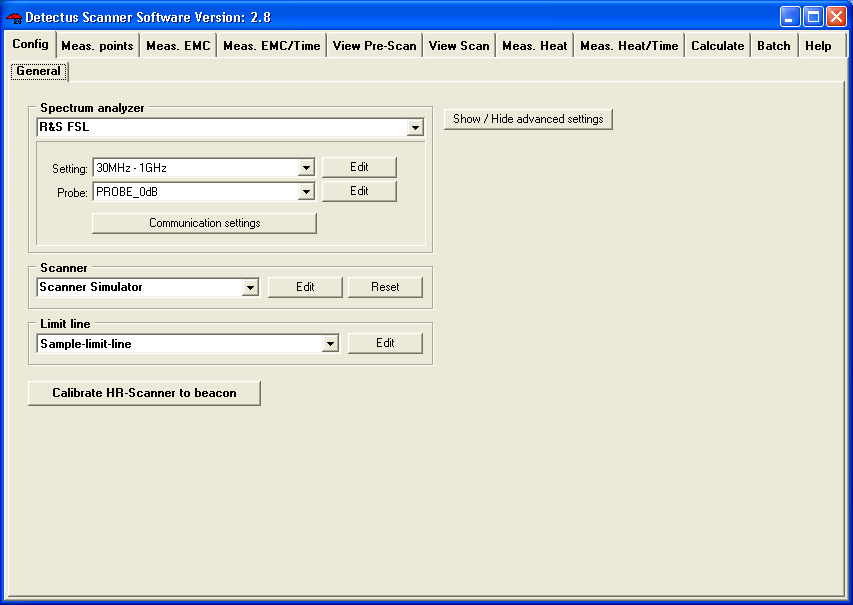
In the Spectrum analyzer box, near Setting, click on the Edit button.
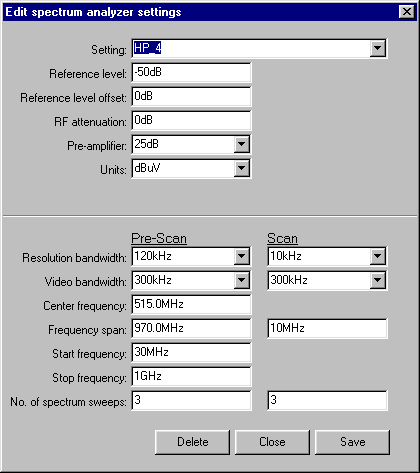
7. Click on the ”down arrow” on the right side of the Setting box and select a suitable setting from the list showing all stored settings. If no suitable setting is found, you may enter a new setting name and alter the settings.
8. Click on the Save button.
9. Click on the Close button.
10. Click on the Config tab.
In the Spectrum analyzer box, near the Probe setting, click on the Edit button.
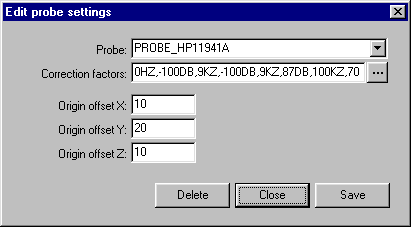
11. Click on the ”down arrow” on the right side of the Probe box and select a suitable setting from the list showing all stored settings. If no suitable setting is found, you may enter a new setting name and alter the settings to suit you. (Refer to “Entering the amplitude correction factors of the near field probe”).
12. Click on the Save button.
13. Click on the Close button.
14. Place the test object on the Scanner table.
15. Click on the Meas. points tab.
16. Click on the General button to select 2.5 dimensional measuring points. It is also possible to generate full 3D measuring points. See “How to generate 3D measuring points” for a detailed description.
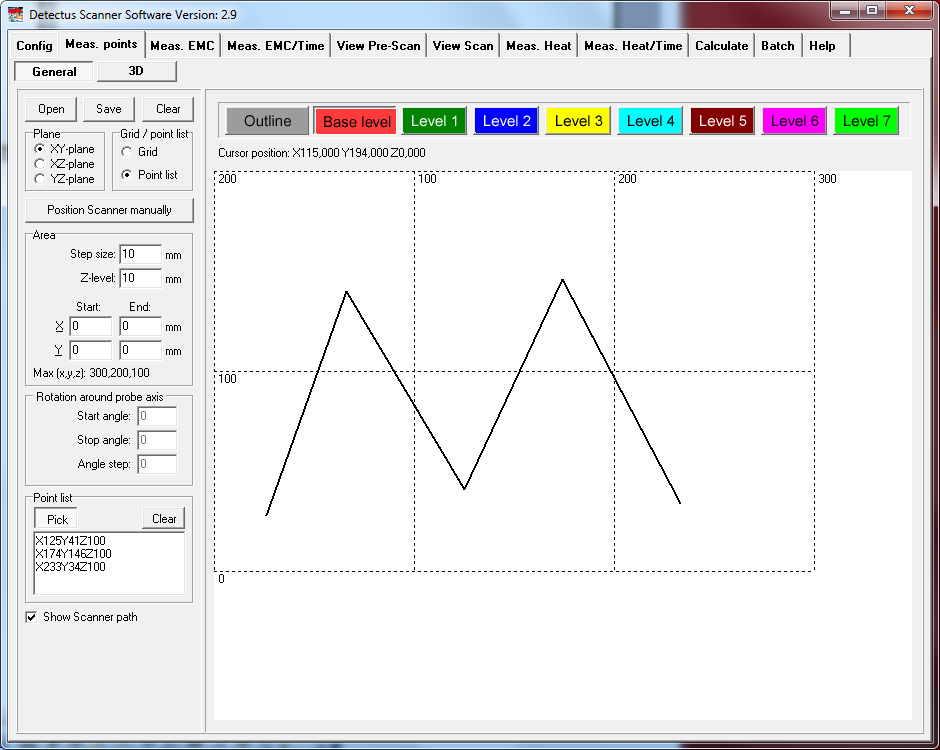
17. In the Grid / Point list box, select Point list.
18. In the Point list box, click on the Pick button.
19. Pick a desired number of points by clicking on the grid.
A dialog box will ask you to enter the Z-level of each point.
20. The measuring points can be saved (as .MP files) for later use by clicking on the Save button.
21. Click on the Meas. EMC tab.
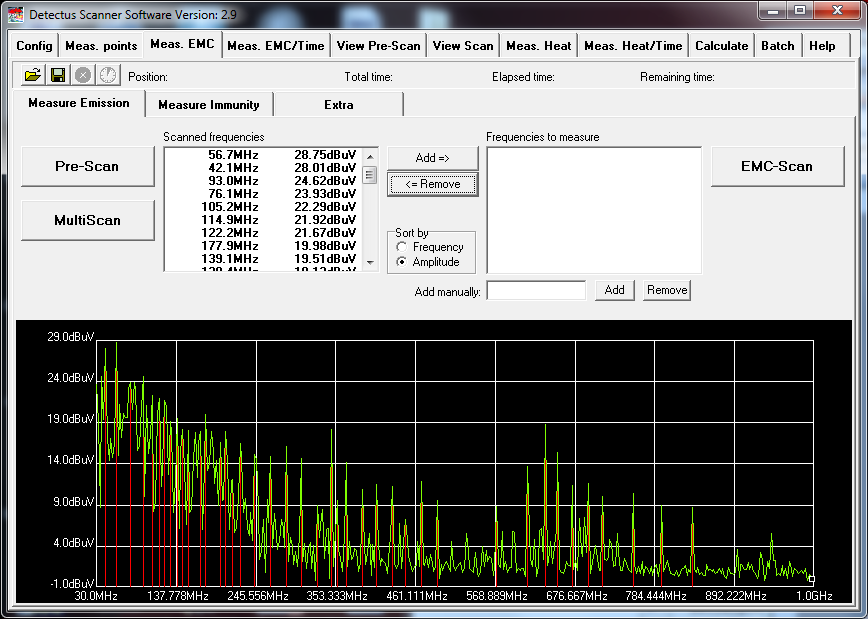
22. Click on the Pre-Scan button to start the wide-band measurement.
(The setting for this measurement was defined in step 6. When the measurement is finished the spectra graph and a list of peaks are displayed.
23. Click on the Save button to save the measurement as a .PRE file.
24. Click on the View Pre-Scan tab.
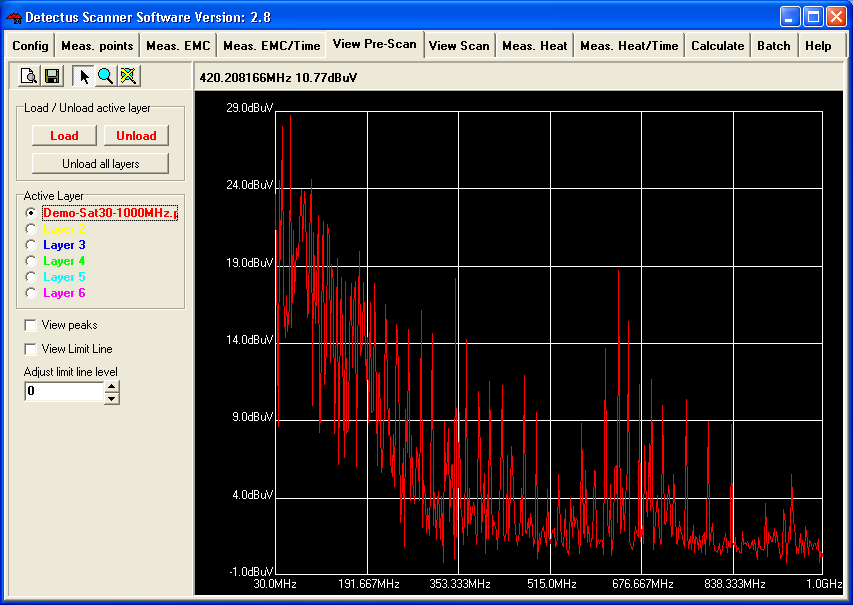
25. Click on the Load button and select the previously saved file.
26. For detailed information on how to operate the View Pre-Scan tab, please refer to table of contents.
27. The result of a Pre-Scan measurement can be documented as a report in HTML format and printed out.
