1. Input Amplifier
The input amplifiers are used for adapting the widely varying signals in the ambient world to the measuring logic of the timer/counter.
These amplifiers have many controls, and it is essential to understand how these controls work together and affect the signal.
The block diagram below shows the order in which the different controls are connected. It is not a complete technical diagram but intended to help understanding the controls.
The menus from which you can adjust the settings for the two main measurement channels are reached by pressing INPUT A respectively INPUT B. See Figure 3-2. The active choices are shown in boldface on the bottom line.


1.1. Impedance
The input impedance can be set to 1 MΩ or 50 Ω by toggling the corresponding softkey.
CAUTION: Switching the impedance to 50 Ω when the input voltage is above 12 Vrms may cause permanent damage to the input circuitry.
1.2. Attenuation
The input signal’s amplitude can be attenuated by 1 or 10 by toggling the softkey marked 1x/10x. Use attenuation whenever the input signal exceeds the dynamic input voltage range ±5 V or else when attenuation can reduce the influence of noise and interference. See the section dealing with these matters at the end of this chapter.
1.3. Coupling
Switch between AC coupling and DC coupling by toggling the softkey AC/DC.

Use the AC coupling feature to eliminate unwanted DC signal components. Always use AC coupling when the AC signal is superimposed on a DC voltage that is higher than the trigger level setting range. However, we recommend AC coupling in many other measurement situations as well.
When you measure symmetrical signals, such as sine and square/triangle waves, AC coupling filters out all DC components. This means that a 0 V trigger level is always centered around the middle of the signal where triggering is most stable.

Signals with changing duty cycle or with a very low or high duty cycle do require DC coupling. Fig. 3-4 shows how pulses can be missed, while Fig. 3-5shows that triggering does not occur at all because the signal amplitude and the hysteresis band are not centered.
NOTE: For explanation of the hysteresis band, see page 4-3.

1.4. Filter
If you cannot obtain a stable reading, the signal-to-noise ratio (often designated S/N or SNR) might be too low, probably less than 6 to 10 dB. Then you should use a filter. Certain conditions call for special solutions like highpass, bandpass or notch filters, but usually the unwanted noise signals have higher frequency than the signal you are interested in. In that case you can utilize the built-in lowpass filters. There are both analog and digital filters, and they can also work together.

Analog Lowpass Filter
The counter has analog LP filters of RC type, one in each of the channels A and B, with a cutoff frequency of approximately 100 kHz, and a signal rejection of 20 dB at 1 MHz.
Accurate frequency measurements of noisy LF signals (up to 200 kHz) can be made when the noise components have significantly higher frequencies than the fundamental signal.
Digital Lowpass Filter
The digital LP filter utilizes the Hold-Off function described below.
With trigger Hold-Off it is possible to insert a deadtime in the input trigger circuit. This means that the input of the counter ignores all hysteresis band crossings by the input signal during a preset time after the first trigger event.
When you set the Hold-Off time to approx. 75% of the cycle time of the signal, erroneous triggering is inhibited around the point where the input signal returns through the hysteresis band. When the signal reaches the trigger point of the next cycle, the set Hold-Off time has elapsed and a new and correct trigger will be initiated. Instead of letting you calculate a suitable Hold-Off time, the counter will do the job for you by converting the filter cutoff frequency you enter via the value input menu below to an equivalent Hold-Off time.

You should be aware of a few limitations to be able to use the digital filter feature effectively and unambiguously. First you must have a rough idea of the frequency to be measured. A cutoff frequency that is too low might give a perfectly stable reading that is too low. In such a case, triggering occurs only on every 2nd, 3rd or 4th cycle. A cutoff frequency that is too
high (>2 times the input frequency) also leads to a stable reading. Here one noise pulse is counted for each half-cycle.
Use an oscilloscope for verification if you are in doubt about the frequency and waveform of your input signal. The cutoff frequency setting range is very wide: 1 Hz – 50 MHz

1.5. Man/Auto
Toggle between manual and automatic triggering with this softkey. When Auto is active the counter automatically measures the peak-to-peak levels of the input signal and sets the trigger level to 50% of that value. The attenuation is also set automatically.
At rise/fall time measurements the trigger levels are automatically set to 10% and 90% of the peak values.
When Manual is active the trigger level is set in the value input menu designated Trig. See below. The current value can be read on the display before entering the menu.
Speed
The Auto-function measures amplitude and calculates trigger level rapidly, but if you aim at higher measurement speed without having to sacrifice the benefits of automatic triggering, then use the Auto Trig Low Freq function to set the lower frequency limit for voltage measurement.
If you know that the signal you are interested in always has a frequency higher than a certain value flow , then you can enter this value from a value input menu. The range for flow is 1 Hz to 100 kHz, and the default value is 100 Hz. The higher value, the faster measurement speed due to more rapid trigger level voltage detection.
Even faster measurement speed can be reached by setting the trigger levels manually. See Trig below.
Follow the instructions here to change the low-frequency limit:
- Press SETTINGS->Misc->Auto Trig Low Freq.
- Use the UP/DOWN arrow keys or the numeric input keys to change the low frequency limit to be used during the trigger level calculation, (default 100 Hz).
- Confirm your choice and leave the SETTINGS menu by pressing EXIT/OK three times.
1.6. Trig
Value input menu for entering the trigger level manually.
Use the UP/DOWN arrow keys or the numeric input keys to set the trigger level. A blinking underscore indicates the cursor position where the next digit will appear. The LEFT arrow key is used for correction, i.e. deleting the position preceding the current cursor position.

NOTE: It is probably easier to make small adjustments around a fixed value by using the arrow keys for incrementation or decrementation. Keep the keys depressed for faster response
NOTE: Switching over from AUTO to MAN Trigger Level is automatic if you enter a trigger level manually.
Auto Once
Converting “Auto” to “Fixed”
The trigger levels used by the auto trigger can be frozen and turned into fixed trigger levels simply by toggling the MAN/AUTO key. The current calculated trigger level that is visible on the display under Trig will be the new fixed manual level. Subsequent measurements will be considerably faster since the signal levels are no longer monitored by the instrument. You should not use this method if the signal levels are unstable.
NOTE: You can use auto trigger on one input and fixed trigger levels on the other.
2. How to Reduce or Ignore Noise and Interference
Sensitive counter input circuits are of course also sensitive to noise. By matching the signal amplitude to the counter’s input sensitivity, you reduce the risk of erroneous counts from noise and interference. These could otherwise ruin a measurement.


To ensure reliable measuring results, the counter has the following functions to reduce or eliminate the effect of noise:
- 10x input attenuator
- Continuously variable trigger level
- Continuously variable hysteresis for some functions
- Analog low-pass noise suppression filter
- Digital low-pass filter (Trigger Hold-Off)
To make reliable measurements possible on very noisy signals, you may use several of the above features simultaneously. Optimizing the input amplitude and the trigger level, using the attenuator and the trigger control, is independent of input frequency and useful over the entire frequency range. LP filters, on the other hand, function selectively over a limited frequency range.
2.1. Trigger Hysteresis
The signal needs to cross the 20 mV input hysteresis band before triggering occurs. This hysteresis prevents the input from self-oscillating and reduces its sensitivity to noise. Other names for trigger hysteresis are “trigger sensitivity” and “noise immunity”. They explain the various characteristics of the hysteresis.

Fig. 3-10 and Fig. 3-12 show how spurious signals can cause the input signal to cross the trigger or hysteresis window more than once per input cycle and give erroneous counts.

Fig. 3-13 shows that less noise still affects the trigger point by advancing or delaying it, but it does not cause erroneous counts. This trigger uncertainty is of particular importance when measuring low frequency signals, since the signal slew rate (in V/s) is low for LF signals. To reduce the trigger uncertainty, it is desirable to cross the hysteresis band as fast as possible.

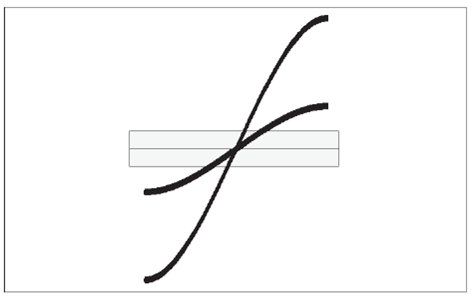
Fig. 3-14 shows that a high amplitude signal passes the hysteresis faster than a low amplitude signal. For low frequency measurements where the trigger uncertainty is of importance, do not attenuate the signal too much, and set the sensitivity of the counter high.
In practice however, trigger errors caused by erroneous counts (Fig. 3-10 and Fig. 3-12) are much more important and require just the opposite measures to be taken.
To avoid erroneous counting caused by spurious signals, you need to avoid excessive input signal amplitudes. This is particularly valid when measuring on high impedance circuitry and when using 1 MW input impedance. Under these conditions, the cables easily pick up noise.
External attenuation and the internal 10x attenuator reduce the signal amplitude, including the noise, while the internal sensitivity control in the counter reduces the counter’s sensitivity, including sensitivity to noise. Reduce excessive signal amplitudes with the 10x attenuator, or with an external coaxial attenuator, or a 10:1 probe.
2.2. How to use Trigger Level Setting
For most frequency measurements, the optimal triggering is obtained by positioning the mean trigger level at mid amplitude, using either a narrow or a wide hysteresis band, depending on the signal characteristics.

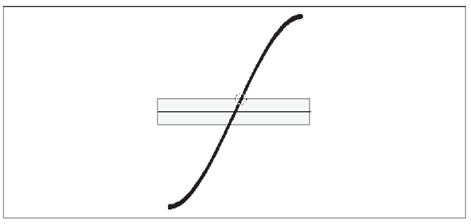
When measuring LF sine wave signals with little noise, you may want to measure with a high sensitivity (narrow hysteresis band) to reduce the trigger uncertainty. Triggering at or close to the middle of the signal leads to the smallest trigger (timing) error since the signal slope is steepest at the sine wave center, see Fig. 3-15.
When you have to avoid erroneous counts due to noisy signals, see Fig. 3-12, expanding the hysteresis window gives the best result if you still center the window around the middle of the input signal. The input signal excursions beyond the hysteresis band should be equally large.
Auto Trigger
For normal frequency measurements, i.e. without arming, the Auto Trigger function changes to Auto (Wide) Hysteresis, thus widening the hysteresis window to lie between 70 % and. 30 % of the peak-to-peak amplitude. This is done with a successive approximation method, by which the signal’s MIN. and MAX. levels are identified, i.e., the levels where triggering just stops. After this MIN./MAX. probing, the counter sets the trigger levels to the calculated values. The default relative trigger levels are indicated by 70 % on Input A and 30 % on Input B. These values can be manually adjusted between 50 % and 100 % on Input A and between 0 % and 50 % on Input B. The signal, however, is only applied to one channel.
Before each frequency measurement the counter repeats this signal probing to identify new MIN/MAX values. A prerequisite to enable AUTO triggering is therefore that the input signal is repetitive, i.e., >100 Hz (default). Another condition is that the signal amplitude does not change significantly after the measurement has started.
NOTE: AUTO trigger limits the maximum measuring rate when an automatic test system makes many measurements per second. Here you can increase the measuring rate by switching off this probing if the signal amplitude is constant. One single command and the AUTO trigger function determines the trigger level once and enters it as a fixed trigger level.
Manual Trigger
Switching to Man Trig also means Narrow Hysteresis at the last Auto Level. Pressing AUTOSET once starts a single automatic trigger level calculation (Auto Once). This calculated value, 50 % of the peak-to-peak amplitude, will be the new fixed trigger level, from which you can make manual adjustments if need be.
Harmonic Distortion
As rule of thumb, stable readings are free from noise or interference.
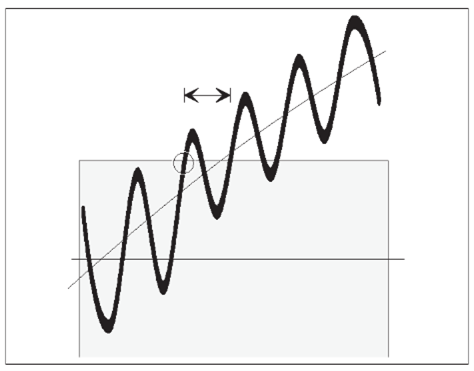
However, stable readings are not necessarily correct; harmonic distortion can cause erroneous yet stable readings. Sine wave signals with much harmonic distortion, see Fig. 3-17, can be measured correctly by shifting the trigger point to a suitable level or by using continuously variable sensitivity, see Fig. 3-16. You can also use Trigger Hold-Off, in case the measurement result is not in line with your expectations.

