VALUE
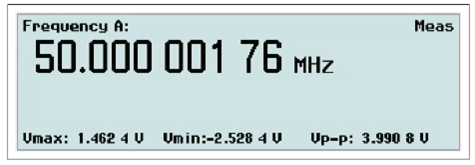
Value mode gives single line numerical presentation of individual results, where the main parameter is displayed in large characters with full resolution together with a number of auxiliary parameters in small characters with limited resolution.
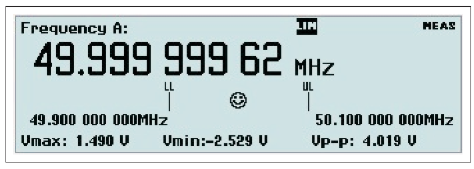
If Limit Behavior is set to Alarm and Limit Mode is set to Range you can visualize the deviation of your measurements in relation to the set limits. The numerical readout is now combined with a traditional analog pointer-type instrument, where the current value is represented by a "smiley". The limits are presented as numerical values below the main parameter, and their positions are marked with vertical bars labelled LL (lower limit) and UL (upper limit) on the autoscaled graph.
If one of the limits has been exceeded, the limit indicator at the top of the display will be flashing. In case the current measurement is out of the visible graph area, it is indicated by means of a left or a right arrowhead.
STAT/PLOT
If you want to treat a number of measurements with statistical methods, this is the key to operate. There are three display modes available by toggling the key:
- Numerical
- Histogram
- Trend Plot
Numerical
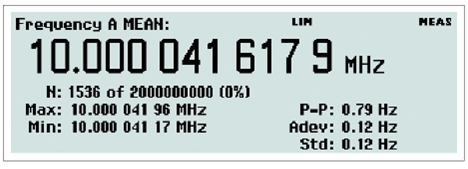
In this mode the statistical information is displayed as numerical data containing the following elements:
- Mean: mean value
- Max: maximum value
- Min: minimum value
- P-P: peak-to-peak deviation
- Adev: Allan deviation
- Std: Standard deviation
Histogram
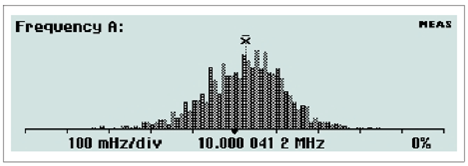
The bins in the histogram are always autoscaled based on the measured data. Limits, if enabled, and center of graph are shown as vertical dotted lines. Data outside the limits are not used for autoscaling but are replaced by an arrow indicating the direction where non-displayed values have been recorded.
Trend Plot
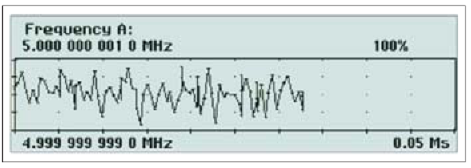
This mode is used for observing periodic fluctuations or possible trends. Each plot terminates (if HOLD is activated) or restarts (if RUN is activated) after the set number of samples. The trend plot is always autoscaled based on the measured data, starting with 0 at restart. Limits are shown as horizontal lines if enabled.
Remote
When the instrument is controlled from the GPIB bus or the USB bus, the operating mode changes to Remote, indicated by the label REM on the display. All front panel keys except CANCEL are then disabled. See also page 2-8 for more information on this key.